Part of our Marketing Analytics guide
What Is Market Sentiment?
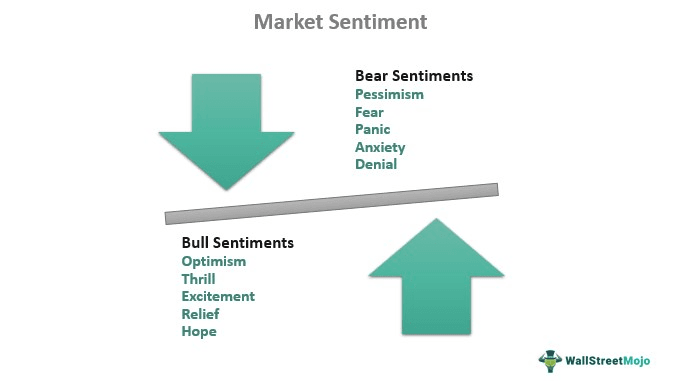
Market sentiment is the psychology of players in the overall market or the trade of a particular security. It signifies the attitude or thought process of investors, whether positive or negative, which can affect the future prices of the security or the market in which they are involved. It is derived from the price movement and activity in the market.
In the short run, the securities keep moving in the same direction for a while before shifting the trajectory. Investors understand this as either a bullish market or a bearish market. The sentiment often drives the movement in the market but does not always mean the accurate financial or fundamental value of a stock or the market.
- Market sentiment is the overall psychology of the market participants relating to a particular security or the market in totality.
- It has an influence over the volumes traded, prices of the security, and the overall movement of the market.
- It is usually not influenced by the fundamental strength of security but by external emotions and thought processes.
- The volatility index, Bullish Percent Index, moving averages, and high-low index are a few technical indicators that help investors gauge the sentiment in the market.
Market Sentiment Analysis Explained
Market sentiment or investor sentiment is the phenomenon through which the psychological positioning of the market, being positive or negative, is assessed.
Technical analysts and intra-day traders heavily rely on market sentiment analysis, which is a significant force driving the market. Of course, it does not necessarily mean that the market or the security is fundamentally strong or shows exceptional potential. However, it still can influence the technical indicators, thereby being a channel of profitability.
The long-term investor needs to be aware of the market’s sentiment. As a result, they make investments concerning fundamentals rather than trends or sentiments. For them, a stock on the rise might be a bad investment, and a stock showing bullish signs might be a good investment idea as they are looking at a long-term picture.
It is also important to know that the fundamental strength and prospects of the market or a particular stock are left out of the picture as the emotions and thought processes of external sources influence the movement in the market. These can be political changes, economic policy changes, organizational irregularities, etc.
In the great investor Warren Buffet’s words, “It is better to be greedy when others are fearful, and be fearful when others are being greedy.” It promotes a contrarian approach to investing, which value investors like Buffet are known for strategizing.
How To Trade It?
Market sentiment analysis can be a tool that allows investors to understand the market better. Regardless of the fundamental strength of the stock or the market, the sentiment in the market can drive the market upwards or downwards as it is essentially the culmination of the psychology of the market participants.
The influence of market sentiment is one of the primary reasons investors can find that the share and the book value match only a few shares on the market. The irregularity is because its values are perceived as higher or lower than its original value based on the emotions and thoughts its products, services, or managing officials can elicit.
The deciding factors for things on and off-market actions are fear and greed. While these are strong motivators to do or to refrain from a particular task, they also decide the overall dominant mood of the market. Based on this, the sentiment shall forecast future prices.
An excellent indicator for investors to understand the global market sentiment is the volume traded on the exchange. If the price rises along with the rise in the volume of trades, it is usually a sign of a bullish standpoint of the market participants.
Sentiments can also be understood as trends that gain momentum and reach a peak before showing opposite run-ups. For example, if a listed company, say, ABC Limited, declares its investment in green technology and is backed by government policies, investors might jump onto the bandwagon to make extra profits and increase the volume of trades, which subsequently increases the prices. Eventually, when the “hype” of a particular stock is neutralized, the price gradually returns to the price that mirrors its book value.
For traders, this understanding can help them ride the momentum formed to their advantage and make additional profits.
Examples
Let us understand this phenomenon with the help of the examples below:
Example #1
Joe is a professional trader and has been trading since 2011. He trades with the mindset that people can influence the prices of stocks more than policies and valuation. Therefore, when the announcement of COVID-19 as a pandemic was announced. As a result, the S&P 50 dropped to 2,300, a fall of approximately 1,000 points from its previous levels.
He knew that there would be chaos and instability in the market. However, he also knew that investing at a time when people were selling would help his profit margins handsomely. Hence, he invested double the amount he usually would and started taking positions in fundamentally strong stocks.
In a matter of weeks, when policies and restrictions were clearly announced and investors experienced a little calm, the stock market skyrocketed, giving Joe more than a healthy return.
Example #2
In October 2022, entrepreneur Elon Musk acquired social media giant Twitter in a $44 billion deal. Almost immediately after acquiring the company, he fired almost 3,700 employees, which accounted for half of Twitter’s workforce.
This action received a lot of backlash from the media, the business world, and investors alike. As a result, Musk’s Tesla shares experienced a significant crash. Investors thrashed his strategies and punished the valuations of the company. As a result, the share prices were down by almost 54%.
There was nothing wrong regarding Tesla’s business model or the plan to justify the crash of over half its price. Instead, the actions of its CEO sparked outrage amongst investors, which resulted in the crash.
However, by the end of November 2022, the prices had started stabilizing, which pointed towards a classic case of market sentiments playing a significant role in the prices of a stock.
Market Sentiment Indicators
A market sentiment index is the majority opinion of the participants in a particular market, which can significantly influence the happenings of that market. For investors, both short and long-term, it can provide insights into the overall mood of the market. With this information or approximation, they can choose to enter or exit their market positions in a more organized manner.
Below are a few market sentiment indicators that help understand the psychology of investors in the market:
- Bullish Percent Index (BPI):
It is calculated based on the index of the stock market. If the chart has 80% or above bullish patterns, it is considered that the market is on a bull run or is bullish. However, if the charts show 20% or below representing bearish patterns, the market is considered to experience a bear run.
- COT:
The commitment of traders or COT report is a sentiment measure widely used in the commodity market. A majority of commodity traders use it to understand the future prices in the market and use it as a contrary indicator and invest accordingly.
- High-Low Index:
This market sentiment index calculated the number of stocks recording a 52-week high versus those registering 52-week lows. The market is considered bearish if thirty or more companies are nearing their 52-week low. On the flip side, if there are seventy or above companies recording a 52-week high, the market is considered to be in a bullish trend.
- Moving Averages:
Most traders who follow market trends use this index in technical analysis. It calculates the 50-day or 200-day average of the price of a particular stock or the index on the whole. If the 50-day average price is higher than the 200-day average, the price is considered bearish, and vice versa.
- VIX:
The volatility Index, or VIX, is a metric that forecasts market volatility in the next 30 days. It is derived from implied volatility and the option prices in the market. The higher the VIX, the more volatility in the market would be in the next month.
Frequently Asked Questions (FAQs)
1. How to measure market sentiment?
Investors and analysts use a variety of indicators to measure the sentiment in the market. The volatility Index (VIX), Bullish Percent Index (BPI), moving averages, and High-Low Index is popular indicators that help market sentiment analysis.
2. How to know market sentiment?
Global market sentiment is directly correlated to the movement of prices. The market is optimistic or bullish if the price shows an upward trend. On the other hand, if the prices dip, the market is pessimistic or bearish.
3. What is a market sentiment indicator?
It is a tool that represents how a particular group of people feel about the economy or a particular market. It helps to gain a basic outline of the sentiment in the market that can affect future prices. It is typically an indicator of the investors’ psychology of a particular security or overall market.
4. Is high market sentiment good?
According to the Bullish Percent Index (BPI), the market is considered bullish or optimistic if the score is above 80%. On the other hand, if the index is below 20%, it is considered pessimistic or bearish.
Recommended Articles
This article has been a guide to what is Market Sentiment. Here, we explain its analysis with its indicators, how to trade it with examples. You can learn more about it from the following articles –