What is MPC Formula (Marginal Propensity To Consume)?
The formula for marginal propensity to consume (MPC) is the increase in consumer spending owing to the increase in disposable income. The MPC formula is derived by dividing the change in consumer spending (ΔC) by the change in disposable income (ΔI).
MPC formula is represented as,
Marginal Propensity to Consume(MPC) formula = Change in Consumer spending / Change in Income
or
Marginal Propensity to Consume formula = ΔC / ΔI
Further, the MPC formula can be elaborated into
Marginal Propensity to Consume formula = (C1 – C0) / (I1 – I0),
where,
- C0 = Initial consumer spending
- C1 = Final consumer spending
- I0 = Initial disposable income
- I1 = Final disposable income
Key Takeaways
- Marginal propensity to consume refers to the ratio of an increase in spending concerning an increase in the disposable income of the household.
- The ratio is usually between zero and one. When MPC is zero, spending and income aren’t related. There is spending even when there is no disposable income.
- When MPC is 1, it means that similar displacement is noticed in spending patterns due to some change in disposable income.
- The marginal propensity to consume (MPC) is the propensity to spend extra money. Depending on income levels; it may change.
- While those with low earnings are more likely to spend on essentials, those with greater incomes are more likely to save.
Explanation of the MPC Formula
We can derive the formula for marginal propensity to consume by using the following steps:
- Identify I0 and C0, the initial disposable income and initial consumer spending, respectively. Then note the final disposable income and consumer spending, denoted by I1 and C1, respectively.
- Now work out the numerator of the formula, which represents the change in consumer spending. It is arrived at by deducting the initial consumption quantity from the final consumption quantity.
Change in consumer spending, C = C1C0
- Now work out the denominator of the formula, which represents the change in disposable income. It is arrived at by deducting the initial disposable income from the final disposable income.
Change in disposable income, I = I1I0
- Now work out the denominator of the formula, which represents the change in disposable income. It is arrived at by deducting the initial disposable income from the final disposable income.
- Change in disposable income, ΔI = I1 – I0
- Finally, the MPC formula is calculated by dividing the change in consumer spending (step 2) by the change in disposable income (step 3), as shown below.
- Marginal Propensity to Consume formula = Change in consumer spending / Change in income, or,
- Marginal Propensity to Consume formula = (C1 – C0) / (I1 – I0)
Examples of MPC Formula (with Excel Template)
Let’s see some simple to advanced examples to understand the calculation MPC formula better.
Marginal Propensity to Consume Formula – Example#1
Let us take the example of the vacation expense of the employees of a particular company. Now let us assume that there is an increment of $160 given to all the employees across the organization due to the excellent business performance of the company. Due to the recent hike, the expense of an average employee for a yearly vacation trip went up by $200. Calculate the marginal propensity to consume for an average employee of the organization.
- Given, Change in consumer spending = $160
- Change in disposable income = $200
The table below shows data for calculating marginal propensity to consume for an average employee of the organization.
Using the formula, the marginal propensity to consume can be calculated as,

MPC formula = Change in consumer spending / Change in disposable income
Marginal propensity to consume = $160 / $200
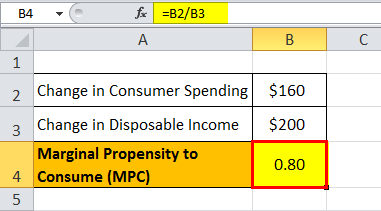
Marginal propensity to consume for an average employee of the organisation= 0.80
Therefore, there is an increase of 80 cents in vacation expenditure for a dollar increase in income.
Marginal Propensity to Consume Formula – Example#2
Let us assume that a shop near Jack’s office sells soft drinks. Jack is one of the biggest customers of the shop and consumes 30 liters of soft drinks every month. In the current month, he got a fat paycheck since he achieved the monthly target. His monthly payout went up from the usual $300 to $400. Consequently, his soft drinks purchase also increased to 35 liters this month. The soft drink costs $5 per liter. Determine the marginal propensity to consume for Jack.
- C0 = 30 * $5 = $150,
- C1 = 35 * $5 = $175,
- I0 = $300 and
- I1 = $400
The following is data for calculation of marginal propensity to consume for Jack.

Therefore, the marginal propensity to consume calculation for Jack is as below,

MPC formula = ($175 – $150) / ($400 – $300)
Marginal propensity to consume = $25 / $100
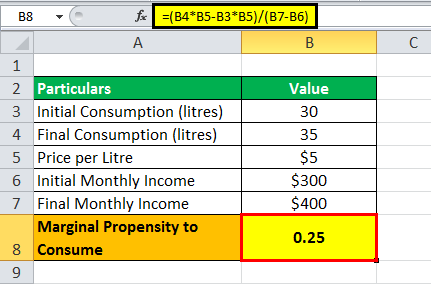
Marginal propensity to consume = 0.25
Therefore, there is an increase of 25 cents in soft drink consumption for a dollar increase in Jack’s disposable income.
Relevance and Use of MPC Formula
The MPC formula is one of the easiest economic formulas in use. If there is an increase in disposable income, some of the extra money is spent. Simply divide the increase in consumer spending by increasing disposable income, and then the ratio of marginal propensity to consume is ready. The ratio normally falls between zero and one, which means that incremental income can either be entirely saved or partially consumed. However, there might be instances where the marginal propensity to consume can have a value either greater than one.
If the marginal propensity to consume is greater than one, then it indicates that the change in income level has resulted in a relatively larger change in the consumption of the particular good. Such a correlation is a characteristic of goods with the price elasticity of demand greater than one such as luxury items.
If MPC = 1, then it indicates that the change in income level has resulted in the same change in good consumption. Such a correlation can be seen for goods with the price elasticity of demand equal to one.
If MPC < 1, then it indicates the change in income levels has resulted in a relatively smaller change in the consumption of the good. Such a correlation can be seen for goods with less than one price elasticity of demand.
If MPC = 0, then it indicates the change in income levels does not change the consumption of the good. Such correlation is applicable for goods with a price elasticity of demand.
Frequently Asked Questions (FAQs)
What is the marginal propensity to spend?
Marginal propensity to save is a metric used in economics to determine how savings fluctuate as income changes. Small changes in income cause huge changes in savings, and vice versa, as indicated by a higher MPS.
Can the total of MPC and MPS be 1?
In a closed economy, MPC + MPS can be 1, indicating that Since an increase in one unit of income will either be spent or conserved, MPS + MPC mathematically equals 1 in a closed economy.
What is the relationship between MPS and MPC?
The marginal propensity to consume (MPC) is the flip side of MPS. According to economic theory, spending and consumption increase as income climbs. As a result, there is an inversely proportionate link between the MPC and MPS.
Recommended Articles
This has been a guide to MPC Formula. Here we discuss how to calculate Marginal Propensity to Consume using practical examples along with downloadable excel templates. You may learn more about Financial Analysis from the following articles –