Part of our Technical Analysis Indicators guide
Overbought Meaning
Overbought refers to market scenarios where stock is traded considerably higher than its fair value. Overvaluation is caused by market sentiments when there is positive news about the company or its potential growth. Trending stocks are bought aggressively. For sellers, it is a profitable opportunity. However, it is a short-term price hike; soon, the market corrects itself, and prices fall back to their intrinsic values.
An overbought stock is considered overpriced in the stock market. By comparing market price and actual worth of securities, overpriced stocks can be spotted easily. This information can be obtained from companies’ financial statements. An oversold market is the polar opposite; stocks are under-priced and about to rise.
- Overbought stocks are overvalued. Such a stock is bought or sold at a price greater than its fair value. Therefore, an impending fall in price is highly likely.
- Technical indicators like Relative Strength Index (RSI) and stochastic oscillator determine whether a stock is overpriced or under-priced. When RSI reads 70 or more, the stock is considered overvalued.
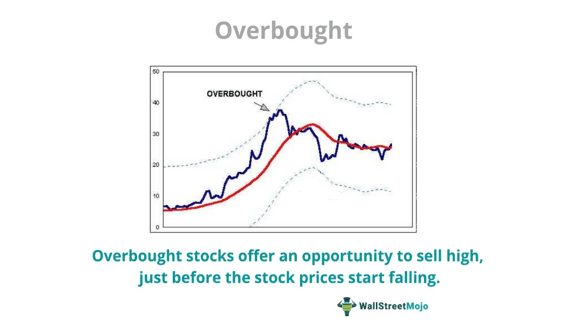
- When stock prices peak, short-term price hikes come to an end—it is the beginning of a downward trend. Investors often look for overbought stocks to sell high.
Overbought Explained
An overbought asset is overvalued. It is a market environment where all analysis, reports, sentiment, and indicators point towards a stock being priced above its actual market price.
Sometimes, a stock is promoted excessively—claiming high returns. The trending stock attracts more buying than selling. The demand surplus results in a bullish stock price movement. Sometimes, despite the hype, a company’s financial statements fail to show much progress; such stocks are called overbought.

For overvalued stocks, bullish price movement is seen consistently—can exist for an extended period. But the trend is unrealistic since it is triggered by market sentiments and investor sentiments. The trend is not based on the company’s actual performance.
Eventually, the market will correct itself—at some point in time. And when that happens, there will be a reversal in the trend. When the market corrects itself, the stock price falls to its intrinsic value—shareholders lose money.
Traders can use various technical oscillators to study the pattern of stock price movement—Relative Strength Index (RSI) ans stochastic oscillator. Traders make crucial buying and selling decisions based on those patterns. Traders take either a short or long position to reap maximum benefits from overbought or oversold securities.
How to Identify Overbought with RSI
First, let us understand what RSI is. The Relative Strength Index (RSI) assesses fluctuations in a stock’s current price—it determines whether a particular stock is overvalued or undervalued.
In 1978, J. Welles Wilder Jr. introduced RSI in his New Concepts in Technical Trading Systems. The RSI readings range between 1 and 100. If the value is or exceeds 70, the security is considered overbought. Alternatively, an RSI value of 30 or less indicates an oversold security.
RSI is a key technical indicator—it alarms traders of a bullish or bearish oscillation in stock prices. It is calculated with the help of average gains and average losses—made by the stock in the recent 14 periods. Thus, it is an effective momentum oscillator.
As the momentum rises—RSI reads 70 or above—there are chances of a trend reversal. Traders see this as a strict ‘no’ for buying. The market can start correcting itself at any moment; stockholders can end up with losses.
Thus, RSI identifies the peak price of a stock—signals shareholders to sell such stocks at this level. This way, traders can amass significant returns before the price pullback.
Traders can take a look at the following chart to understand how they can identify oversold conditions by utilizing the relative strength index indicator:
The purple line in the above S&P 500 E-mini Futures chart represents the relative strength index values that oscillate between 0 and 100. While an RSI value of below 30 indicates oversold conditions in the market, a value exceeding 70 indicates overbought conditions. In the chart, we can observe that the RSI value was above 95 on 31 March 2023, thus signaling overbought conditions in the market.
Traders can observe the RSI values like this on different charts to identify overbought conditions. They can utilize an effective short-selling strategy to make financial gains in these situations. However, if they already hold a position at the time of identifying overbought conditions, they must consider exiting the trade to minimize their losses.
Individuals can learn more about how to spot overbought conditions through the use of the RSI index by looking at more charts like these on the TradingView platform.
Examples
In May 2022, several U.S. stocks were overvalued compared to their financial position. The oscillator’s ratings (including RSI14 levels) signaled the selling of the following stocks:
- Antares Pharma, Inc. (ATRS) has an RSI14 of 78.67.
- Blueknight Energy Partners L.P. (BKEP) has an RSI14 of 74.31.
- Biomea Fusion, Inc. (BMEA) has an RSI14 of 70.54.
Let us look at another example.
In May 2022, NRG Energy Inc. (NRG) is trading at $46.67 and has an RSI of 72.76; thus, it is a signal for stockholders to sell NRG stocks.
Overbought vs Oversold
In the stock market, securities don’t always trade at their intrinsic values. They are bought or sold at a comparatively higher or lower price.
Let us understand these concepts in detail with the help of the following differences between oversold and overbought stocks:
| Basis | Overbought | Oversold |
|---|---|---|
| Meaning | The stocks are overvalued and trade way beyond their fair value | The securities are undervalued and trade significantly below their intrinsic value |
| Price Movement | Upward or bullish momentum | Downward or bearish momentum |
| Caused Due To | Aggressive buying of a security | Excessive selling of stock |
| Major Triggers | Positive news or positive buyer sentiments | Negative information or negative seller sentiments |
| Relative Strength Index (RSI) | 70 or above | 30 or below |
| Stochastic Oscillator | More than 80 points | Less than 20 points |
| Indicates | Period of downfall or price pullback | Market rally or price bounce |
| Strategy | Immediate selling of stock | The right time to buy |
For professional-grade stock and crypto charts, we recommend TradingView – one of the most trusted platforms among traders.
Disclosure: This article contains affiliate links. If you sign up through these links, we may earn a small commission at no extra cost to you.
Frequently Asked Questions (FAQs)
What does stock overbought mean?
Overbought is a condition where particular security is overvalued; it is being bought and sold at a price exceeding its fair or intrinsic value. Such a situation arises when a stock is in high demand—purchased aggressively in the stock market.
What happens when a stock is overbought?
The overbought stock signifies a bullish price momentum. Despite trading at high prices, the stock price will come down to its fair value—when the market corrects itself. Stockholders suffer losses owing to the price pullback.
What is RSI Buy Signal?
The Relative Strength Index (RSI) is the best momentum indicator to detect overbought or oversold stocks. The other commonly used tool is the stochastic oscillator. The RSI analyzes price movements and future possibilities. When the RSI is 30 or lower, it is a sign that the trader should buy the security. At 30, an immediate reversal of the trend is anticipated—the price will bounce owing to market corrections.
Recommended Articles
This has been a guide to overbought stocks and meaning. We discuss overbought stocks, markets, RSI Indicators, investment strategy & overbought vs. oversold. You can learn more about it from the following articles – .
Recommended Articles
Continue with these closely related articles from the same guide.