Overvalued Stocks Meaning
Overvalued stocks are those whose current price does not do justice to the earning potential. As a result, they have an inflated PE Ratio compared to their fundamental value (found using DCF valuation, Comparable Comps). Therefore, analysts expect their share price to fall sharply in the market.
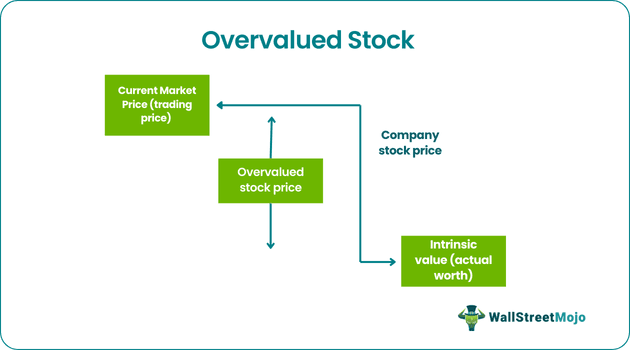
The trading for such stocks takes place at a higher price than its intrinsic value. It is not safe to invest in them since they have a huge chance of a sharp price fall. However, if the financials are strong and have good future potential, investors can consider buying them.
Overvalued Stocks Explained
Overvalued stocks are the ones that trade above their intrinsic value or their actual worth, due to which it has a great chance of experiencing a sudden sharp price fall at some point of time.
The most important thing about overvalued stock calculation is the P/E ratio, which indicates the company’s earnings against the price of the stock. It may be generally traded at a rate that traded at a much higher PE ratio than its peer group.
We have two contrasting theories in the market regarding how to identify overvalued stocks or undervalued stocks. One is based on the perfect efficient market concept. Few analysts believe that fundamental stock analysis is a waste because there cannot be an overvalued or undervalued stock as the market has complete knowledge about the trade and the stocks involved. On the other hand, a group of fundamental analysts firmly believes that there are chances to make money or lose money in the market solely based on the concept of overvaluation or undervaluation and that highly overvalued stocks and undervalued stocks also exist in the market.
List of overvalued stocks are the primary instruments traders use to cover short positions, which means they sell their shares to purchase them again when the price dips to the market standard. Traders may also deal in stocks, which may be an outcome of the premium paid because of the brand name or superior management associated with the company, which sharply increases the value of the stock when compared to peer stocks operating in the same industry.
How To Find?
The most common way to detect such a list of overvalued stocks being traded in the free market is by doing an earning analysis taking the help of a P/E ratio analysis or price-to-earnings ratio analysis. This dimension brings about a sort of comparison by taking the most critical factor, which is the market value of stocks. The most important thing to watch is the P/E ratio, which indicates the company’s earnings against the price of the stock. Highly overvalued stocks may be generally traded at a much higher rate than their peer group.
Analysts making comparisons can create a bucket where they take a few stocks trading at a high price-to-earnings ratio and take some stocks of companies operating in the same industry with a low price-to-earnings ratio and see how much the P/E differs. For example, we can talk about a stock traded at $180 and has earnings per share or EPS of $6. Thus we see the P/E here is dividing the market value of a stock by earnings per share, which is 180/6 = 30. Therefore, the stock is being traded in the market at 30 times more than what its earning is actually.
Examples
Let us understand the concept with some examples.
Example #1
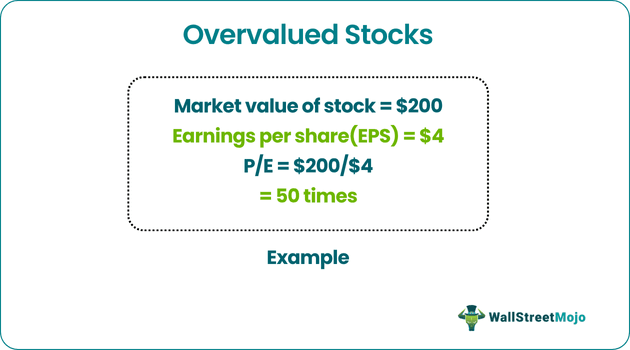
Let’s understand overvalued stock calculation by studying a stock traded at $200 with earnings per share or EPS of $4. Thus we see the P/E here is dividing the stock’s market value by earnings per share, which is 200/4 = 50. Therefore, the stock is traded at 50 times more than its earning in the market. From this example, we can understand how to identify overvalued stocks.
Example #2
Another example of overvalued stock can be the OTT digital platform company called Netflix, a very common online application used in every nook and corner of the world. This company had an initial share price of $120 when it started and eventually peaked too close to $200. The rise shifted its PE ratio to close to 240. The stock is now trading at almost 28 times its book value. Though being overvalued, the analyst still considers the stock and has provided a rating of buying or outperforming based solely on the belief that it has the potential to justify its overvaluation.
Overvalued Stocks Vs. Undervalued Stocks
Overvalued stocks are those whose current market price doesn’t justify their earning potential. Therefore, it has an overrated price-to-earnings ratio, and analysts expect its price to fall sharply in the market. They are the ones that are a result of emotional trading, or logic-less decision making involved with the trade, which may inflate the price of the share in the market, and people, just like herd behavior, may fall for it but eventually realize that there is no value associated with the stock.
On the other hand, undervalued stocks are just the opposite of overvalued stocks. It generally sells at a rate that is quite lower than what its intrinsic or book value is. To calculate the intrinsic value, one can refer to the company’s financial statement and other fundamentals like cash flow, ROA, management of capital, etc. These stocks are excellent in the long run, provided the company performs as buying at a low price can fetch high returns on a market correction.
Recommended Articles
This article has been a guide to Overvalued Stocks and their Meaning. Here we discuss how to spot overvalued stocks along with an example and its differences from Undervalued Stocks. You can learn more from the following articles –