Table Of Contents
Differences Between Fundamental and Technical Analysis
Fundamental analysis refers to analyzing financial aspects of a business like financial statements and financial ratios and other factors like economics and others affecting the business to analyze the fair market value of its share/security. In contrast, technical analysis refers to the analysis of share/security fair price by examining and analyzing the past trends and changes in the price of shares and studying the business's historical information.
Fundamental analysis is a stock valuation methodology that evaluates a stock based on its intrinsic value (fair value). On the other hand, technical analysis is a stock valuation methodology that evaluates a stock based on charts and trends and predicts the stock's future price.
Both methods are used for evaluating the stock and predicting future stock prices. Still, while fundamental analysis focuses on the stock's intrinsic value, technical analysis focuses on the past trend of the stock's price movement.
To give you some examples:
Martin Schwartz, a successful wall street trader, gained areputation and wealth due to Technical Analysis. Whereas, Jim Rogers, a popular investor, owes his success to fundamental analysis. Both of them may disagree on many concepts. But they will surely agree that emotional control is the most critical path to follow.
What is Fundamental Analysis?
Fundamental analysis aims to find the enterprise value of the company. It means arriving at its Intrinsic price. This kind of analysis uses Economic factors. These factors prove the fundamental elements to determine the price. So if you are opting for the Fundamental route, be sure to perform the following analysis:
- Industry Analysis
- Company Analysis
- Economic Analysis
Major Assumptions:
- In the long run, Stock Price corrects itself.
- You can make gains by purchasing an under-valued stock and then wait for the market to correct itself.
This investing technique is adopted by buy, hold, and value investors.
What is Technical Analysis?
It is also a method of evaluating Securities. But the entire game here depends on the statistics generated by the market. So charts and patterns are the Bread and Butter of technical analysis.
So let's see what the characteristics of technical analysis are:
- This analysis uses past price movements to predict future price movements.
- Trends and Patterns play a significant role, rather than the Intrinsic Value.
- Market Price is everything. Factors affecting it are not considered, like in fundamental analysis.
The Three Golden Rules:
Technical Analysts adhere to these three Golden Rules:
- First Rule: Prices discount all information available to the public.
- Second Rule: Price movements are not random. Trends behind the price action can be established by using Technical tools.
- Third Rule: Price Trends are likely to repeat themselves.
Fundamental vs. Technical Analysis Video Explanation
Fundamental vs. Technical Analysis Infographics
Let's see the top differences between Fundamental vs. Technical Analysis.

Steps to Carry Out Fundamental Analysis
Step 1: Perform Industry Analysis
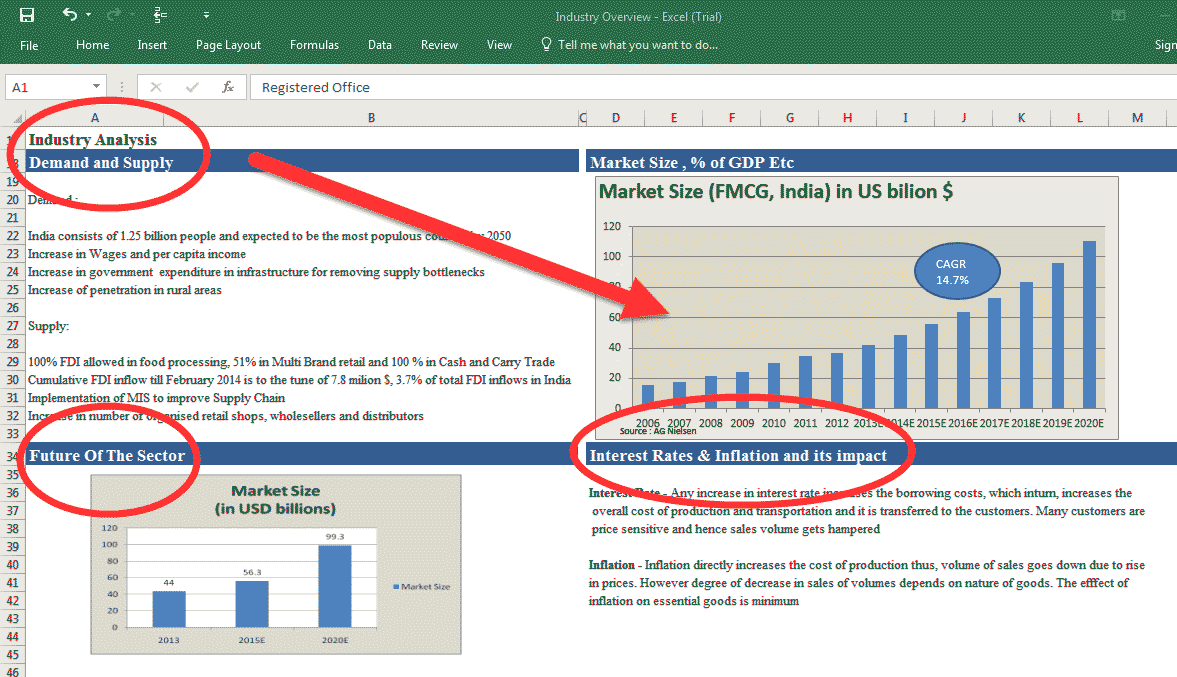
Dig and find out everything about the industry/sector the firm operates.
This type of analysis will give you insights about:
- Sector growth
- Contribution to GDP
- Trends in that sector
- Demand and Supply analysis
Step 2: Perform Company Analysis
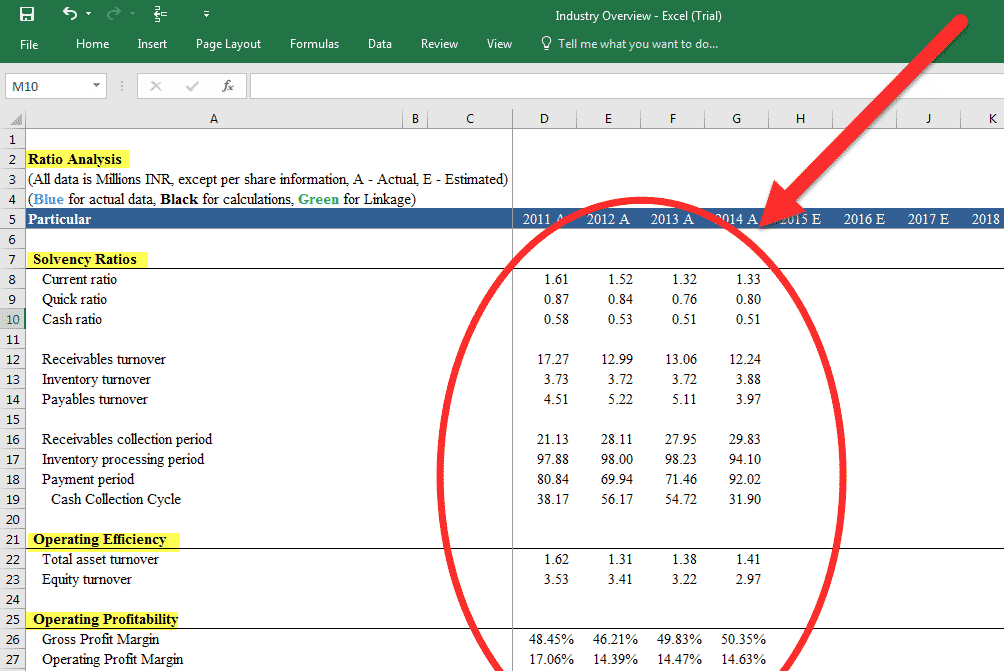
- Understand the inside-out operations of the Company using Ratio Analysis. Carry out Horizontal and Vertical Analysis.
- Evaluate Trends over time. Compute the percentage increase or decrease relative to the base year.
- Understand where the company has applied its resources. Know the proportions in which they are distributed among various accounts (balance sheet and income statement).
- The next tool that you must adopt is Ratio Analysis. It will help you understand the changes in the company's Financial Situation.
- Note that, Ratios are parameters and not absolute measurements. Hence it must be interpreted cautiously.
Step 3: Perform Financial Modeling

- Forecast the future Financial of the Company (financial modeling) for the next five to seven years.
- You may require a lot of information and assumptions here.
- The ultimate goal is to understand how the financial statements and the stock price will look in the future.
Step 4: Carry out Valuation Analysis
Many Valuation techniques are company/industry dependent. For example, in most cases, DCF and Relative Valuation approaches (like PE Multiple, Price to book value ratio, Price to Cash Flow, etc.), SOTP valuation is used. However, you may require other types of approaches based on company type.
Discounted Cash Flow Analysis:
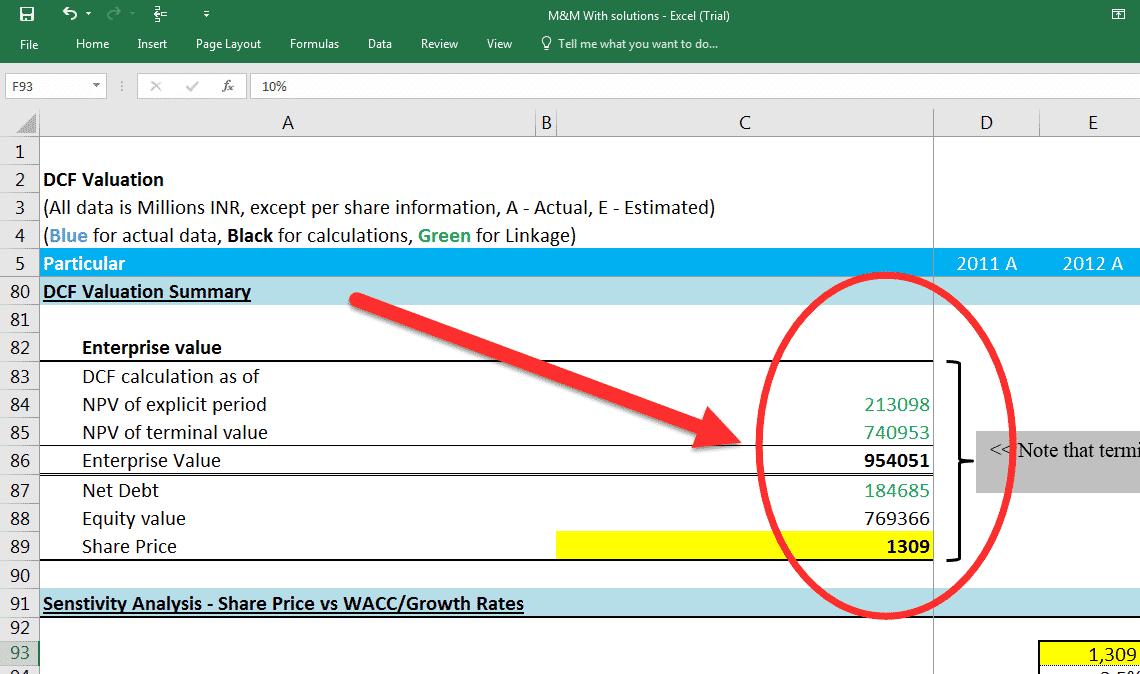
In Discounted Cash flow analysis, you arrive at an Intrinsic price. The methods and procedures used for the same are interesting. We are not going to discuss the same in detail in this article. But let's jump to the step where you arrive at your intrinsic Share Price for the company. So here is how you will interpret your results.
- If Market Price > Intrinsic Share Price= Stock is Overvalued, the recommendation is to sell the stock.
- If Market Price < Intrinsic Share Price= Stock is Undervalued, Recommendation here will be to Buy the stock.
Relative Valuation Analysis:

This valuation technique makes use of comparable Company Analysis. You value your company of interest by comparing it to its peer group.
Some of the valuation parameters used in this are:
Steps to Carry Out Technical Analysis
Step 1: Identify which Securities interest you!
A little research on which sector is currently trending will help you decide what to buy or sell. However, it is the first and the major step you will take.
Step 2: Identify the best-suited Strategy.
Not all the stocks will fit into the same strategy. Therefore, identifying the best strategy for the selected stocks is essential.
Step 3: Select a Trading Account
You need the right share trading account with the required support, functionality, and cost.
Step 4: Know your Tools & Interfaces
Select those tools that fit your trading requirements and strategies. There are a lot of free tools available. You can try them first to know their features as a novice trader.
Step 5: Always Paper Trade first!
It's a big world out there. To jump into the Trading Jungle without any prior knowledge is a big mistake. I would suggest you spend a month testing your system with the end-of-day market data. Then, select a few stocks that meet your technical indicators requirements. See how they are doing each day.
Step 6: Set Stop Loss
Holding a losing Trade will dig a deeper hole for you. Set a Stop loss no matter what stock you choose.
Key Differences
- Fundamental analysis is based on a long-term approach to evaluating the stock and suggests data analysis for several years. This type of approach helps the investors select those stocks for investment whose value is expected to increase in the future. Technical analysis is based on a short-term approach to evaluating the stocks. For this reason, it is more relevant for day traders as the purpose of the analysis is to select those stocks that can be purchased now to be sold at higher prices in a shorter period.
- Fundamental analysis considers the intrinsic value of a stock for identifying opportunities for long-term investment. The technical analysis evaluates the past price movements of a stock. It predicts how a stock will perform in the future, i.e., whether its price is expected to increase or decrease over a shorter period.
- The objective of fundamental analysis is investing since it is a long-term approach. However, technical analysis is concerned with trading objectives.
- Decisions are arrived at in fundamental analysis based on available data and financial statements. On the other hand, decisions are based on charts and price movement trends in technical analysis.
- Fundamental analysis considers both past and presented data about a stock, whereas technical analysis considers only past data.
- Fundamental analysis is useful for long-term investors. In contrast, technical analysis is useful for day traders and short-term traders who wish to earn profits by selling the stock over a shorter period.
- No assumptions are involved in fundamental analysis. In technical analysis, many assumptions are to be taken: price will continue to follow the past trend in the future.
- Fundamental analysis can help decide whether a stock is overvalued or undervalued based on its intrinsic value. On the contrary, technical analysis helps one decide the correct time to purchase or sell a stock based on price movements.
Fundamental vs. Technical Analysis Comparative Table
| Criteria | Fundamental Analysis | Technical Analysis | ||
| Meaning | Analysis of stock based on the calculation of its intrinsic value | Analysis of stock and prediction of its price by the use of trends and charts about its price movement | ||
| Purpose | Evaluate the intrinsic value of stock and make a decision regarding investment | Analyze the correct time to enter or exit from the market with respect to a stock based on predicted future prices | ||
| Relevance | Long term investments | Short term investments | ||
| Function served | Investing | Trading | ||
| Basis of decision | Historic and present data | Historic data | ||
| Source of data | Financial statements and the company's present and past performance | Charts and trends | ||
| The factor for buying stock | When the stock price is less than the intrinsic value | When an investor believes that investor can be sold at a higher price in the future | ||
| Concepts used | Return on equity and return on assets | Dow theory, price data | ||
| Approach followed | Long term | Short term | ||
| Assumptions | No assumptions are taken. | Many assumptions are taken, such as a similar price trend will follow |
Advantages & Disadvantages
#1 - Fundamental Analysis
Advantages
- Analytical methods: The methods and approaches used in Fundamental analysis are based on sound financial data. It eliminates the room for personal bias.
- 360 Degree Focus: Fundamental analysis also considers long-term economic, demographic, technological, and consumer trends.
- A systematic approach for deducing the Value: The statistical and analytical tools used help arrive at a proper Buy/Sell recommendation.
- Better Understanding: Rigorous accounting and financial analysis help gauge a better understanding of everything.
Disadvantages
- Time-consuming: Carrying out Industry analysis, financial modeling, and valuation is not a cup of tea. It can get complicated and may need a lot of hard work.
- Assumptions centric: Assumptions play a vital role in forecasting the financials. So it is crucial to consider the best and the worst-case scenario. Unexpected negative economic, political, or legislative changes may cause problems.
#2 - Technical Analysis
Advantages
- Gives insights on volume trends: Demand & Supply govern the trading market. Thus it tells you a lot about Traders' Sentiments. You can judge how the overall market is working. Usually, High demand pushes up prices, and high supply pushes down prices.
- Tells you when to enter and exit: Technical analysis can tell you when to enter or exit from the game.
- Provides current information: Price reflects all the available information about an asset. Prices may increase or decrease, but ultimately the current price is the balancing point for all information.
- Patterns give you direction: You can use patterns as a guide to direct your buy and sell decisions.
Disadvantages
- Too many indicators spoil the charts: Too many indicators can produce confusing signals which may affect your analysis.
- Underlying fundamentals ignored: Technical analysis does not consider the underlying fundamentals of a company. It can prove risky in case of long time frames.
Fundamental vs. Technical Analysis Video
Conclusion
Both methodologies are being used by investors around the globe for market-related decisions. However, they are different from each other because while fundamental analysis is based on intrinsic value, technical analysis is based on historical price movements to predict the future prices of stock.
The fundamental analysis places its reliance on all those factors (known as fundamentals) that can influence a stock's price, such as economic, financial, and other relevant factors. It is based on the thought that though the prices don't correspond to the effect of fundamentals in the short-term, in the long run, the stock prices will adjust according to the fundamentals.
Technical analysis studies the historical price movement of the stock and is based on the stock market prices rather than the factors that may influence them. It doesn't consider the stock's value; instead, it analyses the past trends and predicts future prices accordingly.

