Part of our Microeconomics guide
Production Possibility Frontier Definition
The production possibility frontier (PPF) is a visual representation used to illustrate the maximum possible output combinations of two separate products that can be produced using the same amount of limited resources.
The illustration is used to determine which output combination is the most efficient and which product you should be scaling back given the limited amount of resources at your disposal. Businesses and governments both utilize this financial model to improve efficiency.
- The production possibility frontier is a visual representation showing the most efficient outcomes when producing two goods using the same amount of limited resources.
- With resources being limited, the illustration will show the trade-off that must occur to produce more of one product over the other.
- The production possibility frontier graph is often referred to as the production possibilities curve.
- Businesses and economies will utilize the production possibility curve to improve efficiency.
- The concept can be applied to help an economy in determining the distribution of resources optimally.
How Does Production Possibility Frontier Work?
The Production possibility frontier involves graphical representation. The production possibility frontier graph is often referred to as the production possibilities curve. The graph describes the number of Product A goods represented on one axis and the number of Product B goods represented on the other axis. The graph will show a sloping curve that’s bowed out.
Since the resources are limited, the curve will represent the trade-off that will occur. If you produce more Product A, you will have to produce less Product B and vice versa. Producing less of one product to produce more of another product is referred to as the opportunity cost. This is the cost you may have to incur for allocating your scarce resources to make more of one product over the other.
In business, there are four factors of production, these include
- Land (Natural Resources)
- Labor (Human Input)
- Capital (means of production)
- Enterprise (entrepreneurship)
These factors are limited in nature and must be appropriately distributed to maximize a business or economy’s output. If you are not utilizing the resources correctly, your production efficiency is underutilized, and you are losing the chance of making more profit.
Reading the Model
The production possibility frontier model will look like a curve sloping downwards. It will have combinations of products A and B. The curve will be bowed outward, representing the different possible output combinations. The idea is to achieve production levels that will land on the production possibility curve, representing an efficient manufacturing combination.
If the manufacturing combination falls within the curve, you are not using all of the resources available to you, and the manufacturing combination is regarded as inefficient. However, some other situations may also lead to this scenario, such as a recession where the demand would experience a significant decrease.
The manufacturing combination that lands outside the curve will imply that you wouldn’t have the number of resources needed to attain the desired production levels.
Shifts in the Curve
Businesses and economies can shift the production possibility curve outwards with certain improvements. For example, if a company develops a new technology that can speed up making cheese, the output would also increase. This increase in production will shift the curve outwards as long as the other production factors remain constant.
On the other hand, the curve can also shift inwards during times of economic hardships. For example, if a company had to layoff workers due to financial hardship, the production levels would drop as you wouldn’t have the same labor to produce the goods.
Production Possibility Frontier Example
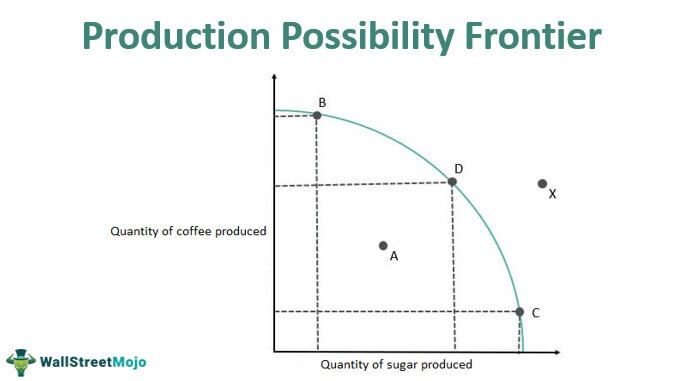
Let us understand the definition and aspects of the production possibility frontier at a deeper level with an example. Suppose an economy produces only two commodities, sugar and coffee. The production possibility diagram will show as a graph the most efficient output levels for the two goods.
The curve points will represent various production levels that are most efficient for the economy, given the limited availability of resources.

Points B, D, and C represent the most efficient use of resources to generate the best sugar and coffee production combinations. If you decide you want to produce more sugar because of an increase in demand, you will have to decrease the amount of coffee produced. The same goes for making more coffee – you will have to sacrifice sugar production.
If your production levels are at point A, you are underutilizing the resources available at your disposal. This can cause supply chain disruptions, among other negative consequences.
To achieve point X production levels, you will have to increase the number of resources available. For example, technological advancements can improve certain aspects of producing coffee and sugar. If you apply the new technology, you can increase production levels to point X.
How Does Production Possibility Frontier Affect the Economy?
A country can use this financial model and the production possibility curve to determine the best possible way of distributing resources to maximize efficiency and output. This is a significant factor in a country’s trade balance and can affect the gross domestic product (GDP).
The production possibility curve will showcase the constraints on achieving different production levels to maximize and improve efficiency. Shifts in the production possibility curve can symbolize either economic expansion or contraction.
Different types of economies will require distinct approaches to determine the production possibility frontier. For example, in a market economy, supply and demand forces will determine the number of goods that should be produced. This differs from a command economy, where the government will dictate the number of goods to be produced.
All economies want to see an outward shift in the production possibilities curve. This can only happen by generating more demand for either or both products. If demand increases, the production levels will need to be shifted as well to reflect those changes. Economies can also experience inward shifts in the graphical representation where the country may be experiencing a recession that caused a decrease in the demand and production for goods.
Some economies have tried other methods of shifting the production possibilities curve. They have had success by lowering the unemployment rate and getting those people back into the workforce. As long as the workers are paid a living wage, their income will increase demand for goods and thereby cause a shift in demand.
Recommended Articles
This article has been a guide to Production Possibility Frontier. Here, we discuss how it works, along with an example. You may learn more about financing from the following articles –
Recommended Articles
Continue with these closely related articles from the same guide.