What is a Demand Curve?
The demand curve is a graphical representation of the relationship between price and demand. The graphs show the commodity’s price on the Y-axis and quantity on the X-axis. It follows the economics law of demand.
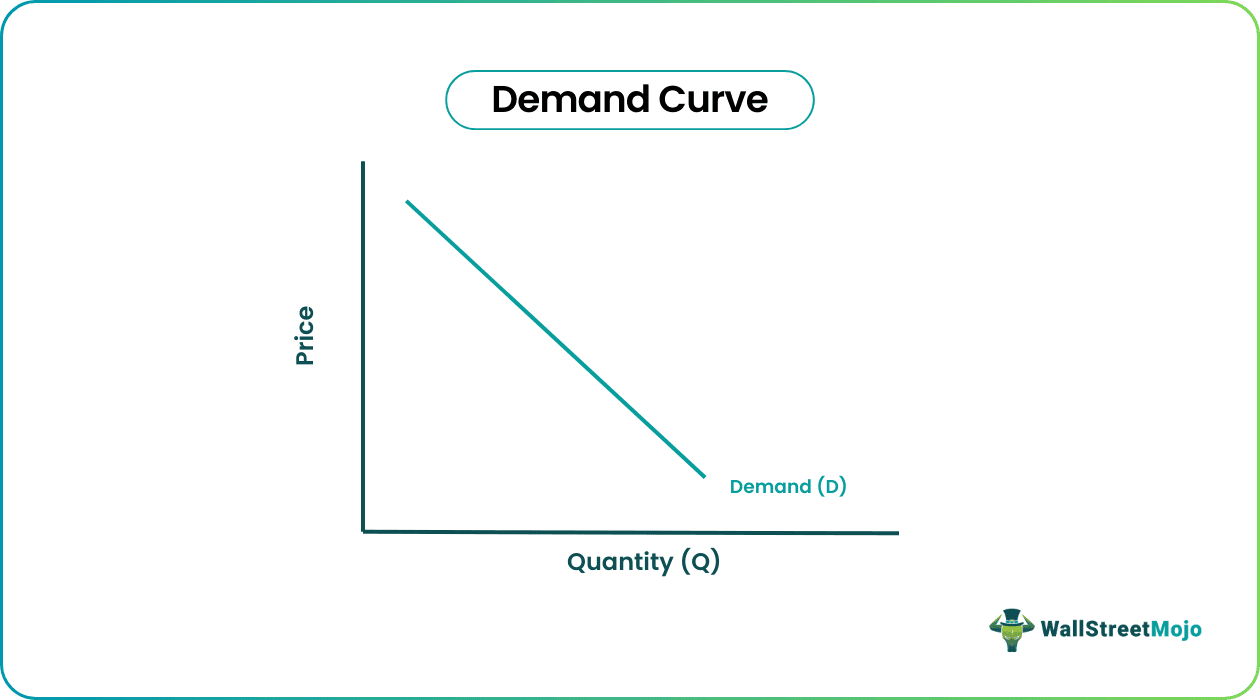
According to the law of demand, when product price decreases, its demand increases and vice-versa. The fundamental principle charts the change in the demand for goods (measured in quantity) at different price levels.
Key Takeaways
- A demand curve is a graphical representation of a change in product demand brought out by a change in price. A product’s price is inversely related to demand—provided other factors remain constant.
- Any increase or decrease in demand due to a fall or rise in price is depicted by a downward or upward movement.
- The curve shifts rightward or leftward when there is an increase or decrease in the product requirement. In addition to price, Demand changes are brought out by consumer income, consumer preference, consumer expectation, and the supply of goods.
Demand Curve Explained
The demand curve correlates goods demand at various price levels. Demand can be elastic or inelastic. Elasticity here refers to demand being sensitive to price. Alternatively, in certain markets, demand is not affected by the change in price—inelastic demand.
In economics, the demand curve is based on the law of demand. The law of demand depicts an inverse relationship between goods price and goods demand. Based on price changes, the curve can shift downward or upward. Hence, the law of demand renders a downward sloping curve—demand goes up when goods price falls.
Apart from the commodity price, there are various other factors that affect the curve:
- Change in consumer income.
- Rise or fall in the price of substitute or complementary goods.
- A shift in consumer preference towards the competitor’s product.
- Increase or decrease in the product supply.
- Consumer’s expectations from the product.
Shifts in Demand Curve
We observe a shift in the curve when the requirement for commodity changes due to factors other than price. Following are the two conditions in this context:
Shifts Towards Right: An increase in consumer preference or income level leads to a rise in goods demand. Also, when the supply of goods decreases or when consumers anticipate a future price rise, demand increases—a rightward shift of the curve.
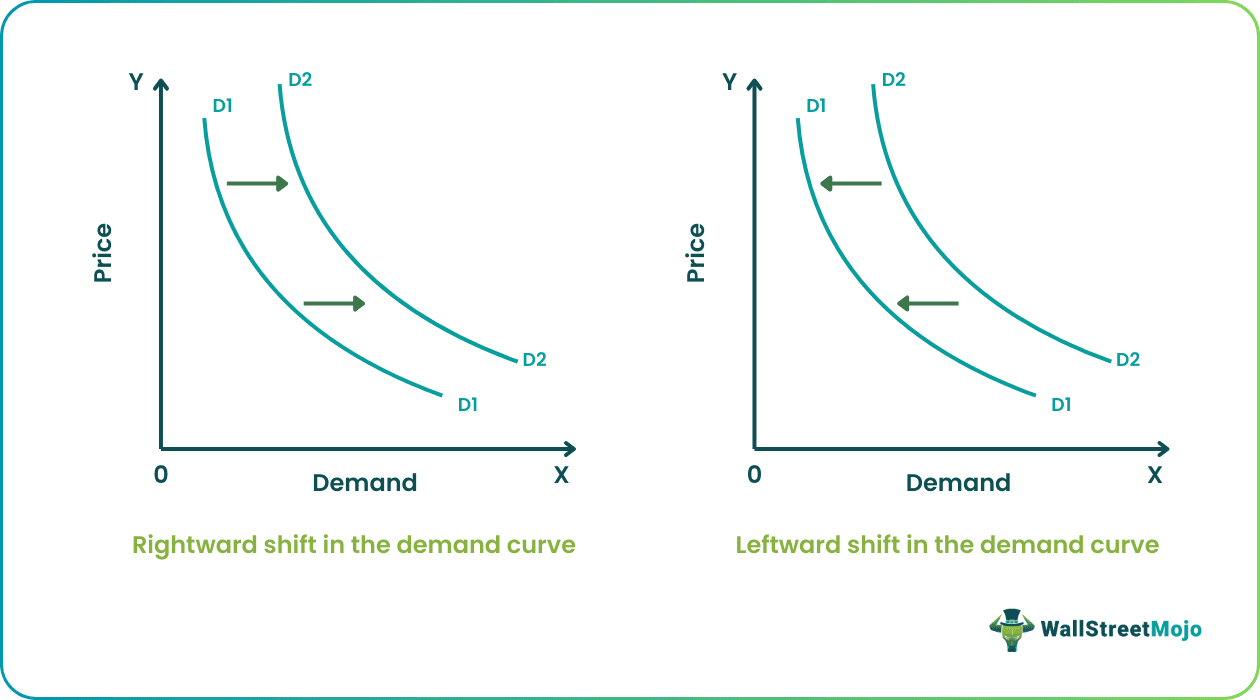
Shifts Towards Left: In contrast, when consumer preference or income level decreases, there is a fall in demand. Similarly, a rise in the supply of goods and anticipation of price reduction reduces demand. In such scenarios, the curve shifts leftward.
Movements Along the Demand Curve
Upward and downward movements on the graph are brought out by changes in price (and not other factors). There is an inverse relationship between price and demand.
Upward Movement: If the curve moves upward, the price of goods increases—demand falls at the same rate.
Downward Movement: On the other hand, if there is a downward movement, the price of the goods falls—demand rises proportionately.
Types
In economics, it is classified as follows:
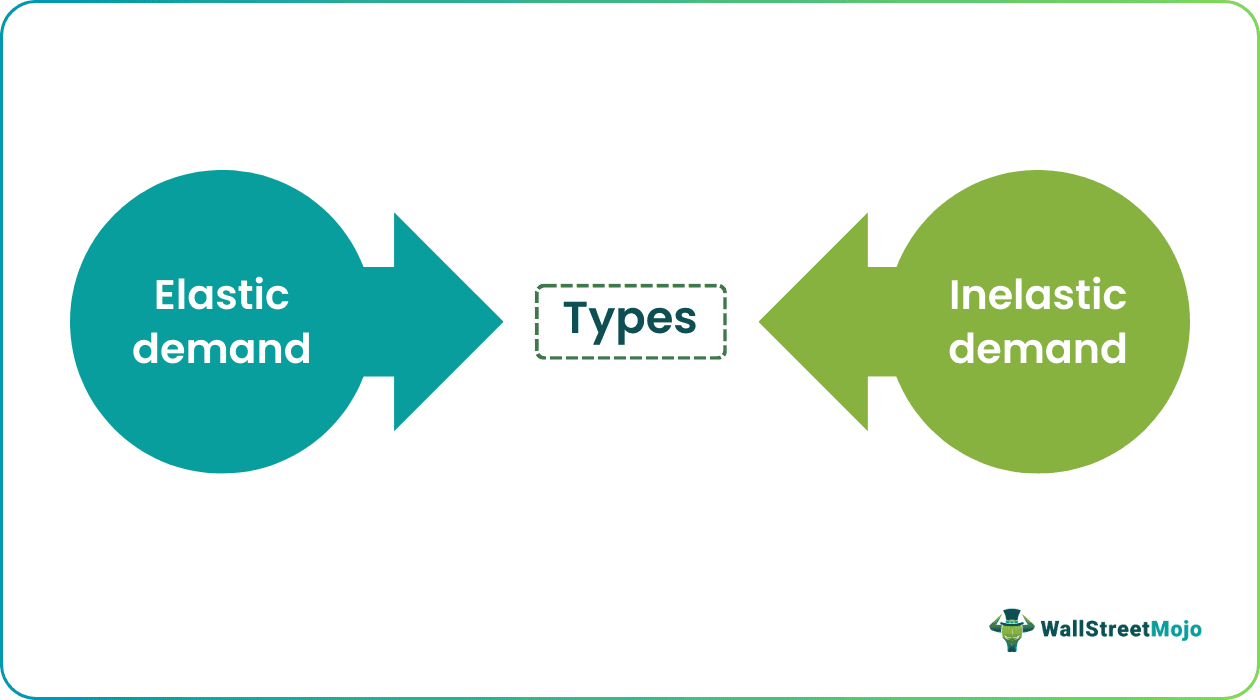
#1 – Elastic Demand
When a price rise causes a sharp decline in goods demand, the scenario is called an Elastic demand. Also, when price reduction causes an increase in demand, the market behavior is considered elastic.
Let us assume that there are two hotels in a tourist destination with the same room tariffs. If the first hotel reduces its tariff by 10%, the demand for its hotel rooms will increase by 20%.
#2 – Inelastic Demand
If the price change doesn’t affect an item’s demand, it is called inelastic demand. Perishable items and life-saving drugs are examples of inelastic demand. For instance, if the milk price increases by 5%, its demand will remain the same—it is an essential commodity.
Examples
Let us see some examples to understand various demand scenarios in the market.
Elastic Demand Curve Example
The price of soft drinks is $3 per can, and the market demand is 40,000 cans per month. Next month, the price goes up to $3.50, and the demand falls to 30,000 cans. Then, in the consecutive month, the price changes to $4—demand further goes down to 25,000 cans. Later price hits $5 per can, and demand plummets to 15,000 cans per month. Plot the demand curve graph.
Solution:
Elastic Demand Formula
e(p) = (∆Q/Q) / (∆P/P)
Here,
- e(p) is the price elasticity of demand.
- ∆Q is the change in demanded quantity.
- Q is the previous quantity.
- ∆P is the change in the price of the product.
- P is the previous price of the product.
Relevance and Use of Elastic Demand Formula
- Based on this concept, companies can make important product pricing decisions.
- If a product falls under the elastic demand curve, substitutes can easily replace that product. Therefore, companies should prepare a price-volume analysis before increasing the price of products.
- On the other hand, if the product has an inelastic demand curve (availability of substitutes), companies can increase their prices.
Demand Schedule
Below is the data for the price and market demand of the soft drink cans:
| Price Per Soft Drink Can (in $) | Quantity Demanded (in Units) | e(p) = (∆Q/Q) / (∆P/P) |
| 3.00 | 40000 | N/A |
| 3.50 | 30000 | (-10000/40000) / (0.50/3.00) = -1.5 |
| 4.00 | 25000 | (-5000/30000) / (0.50/3.50) = -1.17 |
| 5.00 | 15000 | (-10000/25000) / (1.00/4.00) = -0.625 |
Elastic Demand Curve Diagram
Below is the elastic curve for the above data:

Based on the graph, we observe that when prices shoot up, the demand for soft drinks goes down. That’s why the curve slope is steep.
Inelastic Demand Curve Example
Given below is the data of a dairy. The price change for milk per liter (over a period of four months) resulted in the following shift in demand:
Demand Schedule
| Price Per Litre of Milk (in $) | Quantity Demanded (in Litres) |
| 1.00 | 200 |
| 1.10 | 190 |
| 1.15 | 180 |
| 1.25 | 170 |
Solution:
Inelastic Demand Curve Graph
The above data is represented as follows:

Based on the graph, we infer that demand does not change even when price changes considerably—an inelastic demand curve.
Frequently Asked Questions (FAQs)
What does a demand curve show?
The graph depicts the change in demand based on price changes. It shows the commodity’s price on the Y-axis and the quantity demanded on the X-axis.
When does the demand curve shift to the right?
The graphical representation shifts rightward when the demand increases due to the following reasons:
● Consumer income rises,
● Consumers’ preference increases toward the goods,
● Supply of goods fall
● Consumers assume a future price rise
What are the types of the demand curve?
In economics theory, there are different kinds of curves. Primarily, demand curves are classified into elastic, inelastic, individual, and market curves.
Recommended Articles
This has been a guide to Demand Curve and its definition. We discuss demand curve shifts, definition, elasticity, slope, graph, and the law of demand using examples. You can learn more from the following articles –