
What Is Risk-Adjusted NPV?
Risk-adjusted NPV is associated with gauging the risk from a project or investment based on its required rate of return. The net present value is the accumulated value of the project’s expected cash inflows and outflows against each other.
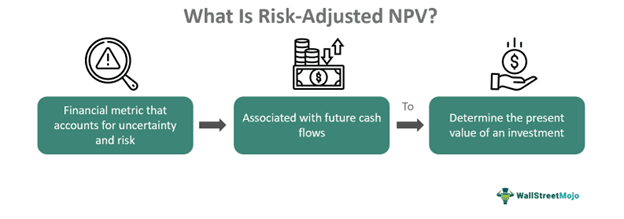
It is also known as the Expected Net Present Value and, therefore, represented as eNPV in calculations. It is the indicator of risk associated with an investment’s projected cash flow and the variation in results. The fluctuation results from all the probabilities that impact the future predicted result to determine loss adjusted value.
Key Takeaways
- Risk-adjusted NPV is the sum of all the probable scenarios’ impact on an investment or project’s cash inflow and outflow, defining the associated risk.
- Analysts and researchers tend to pursue the risk-adjusted NPV as it accounts for the uncertainties associated with a project and, therefore, is considered accurate and reliable.
- Apart from finance and project management, the eNPC is significantly used in the drug industry in the R&D department.
- Despite its accuracy and relevance, investors are advised not to judge the project’s future only based on the NPV value.
Risk-Adjusted NPV Explained
Risk-adjusted NPV signifies the importance of risk associated with any project undertaken or investment made in the market. It is a relevant indicator of the cash flow from the project and the potential variations that may impact the result. Investors can use the metric to understand the probable risks and make better investment decisions based on the value.
In simple terms, the risk-adjusted cash flow and premium rate are added together to arrive at a value that represents risk, which is considered future cash flow from the investment. In this scenario, the investor does not use the traditional NPV but accounts for all the possible threats associated with the project to have a clear idea of the potential return from the investment.
It is the sum of all the present cash flow values adjusted with a risk rate, also known as cut-off or risk premium, to arrive at a future cash flow value. A positive NPV refers to a profitable scenario or project; however, a negative NPV indicates that the investment is non-profitable. Analysts use the eNPV to understand the future cash flow from an investment, but it should not be the only indicator while deriving a project’s future value. Without eNPV, there is no viable choice to gauge future cash flows parallel to the associated risk.
Risk-Adjusted NPV Formula
In risk-adjusted NPV analysis, the final expected net present value (eNPV) is determined by considering multiple scenarios, each with its probability of occurrence. The eNPV is calculated by summing the products of each scenario’s NPV and its corresponding probability. The formula for calculating eNPV is:
Risk-adjusted NPV (eNPV) = Σ (p × NPV scenario)
Where:
- p represents the occurrence probability of each scenario.
- NPV scenario denotes the net present value calculated for each scenario.
Examples
Here are two distinct risk-adjusted NPV examples to help understand the concept better:
Example #1
Suppose an investment company invests in construction projects in New York. One of the main projects is to build a bridge between two important business areas, and people crossing the bridge will pay a crossing fee, which will accumulate as revenue from the project.
Now, when the company wants to determine the project’s risk-adjusted NPV, there are three scenarios: the base case is people will occasionally cross the bridge, and the traffic and crowd will remain the same; the best case scenario is people will cross the bridge in huge amount, and the revenue will increase also it will help people save time in commute. Also, the third possible situation is no one will use the bridge, and the whole project will generate no or negligible revenue.
The calculated net present value for each situation is
| Case | NPV | Probability |
| Best | $90000 | 0.7 |
| Base | $45000 | 0.1 |
| Worst | $18000 | 0.2 |
As per the formula
Expected NPV = best case NPV × best case probability + base case NPV × base case probability + worst case NPV × worst case probability
= 90,000 × 0.7 + 45,000 × 0.1 + 18,000 × 0.2 = $711,000
The eNPV of the bridge construction is $711,000. In this example, the investment company comprehends the risk-adjusted cash flow from the project, considering all possible scenarios.
Example #2
Suppose Jennifer is a new stock market investor. She comes across a stock that she believes has high return potential. To ensure that she is investing in the right stock, Jennifer decides to determine the risk-adjusted net present value of the investment.
Now, there are three possible situations –
The base case is when the stock remains stagnant and does not move much on either side. Another is the best-case scenario when a stock makes a bull run, and Jennifer registers good profit, and the third is the worst-case scenario in which the stock price declines and Jennifer suffers a loss. The calculated NPV of all these cases is –
| Case | NPV | Probability |
| Best | $99000 | 0.5 |
| Base | $36000 | 0.3 |
| Worst | $27000 | 0.2 |
Putting the values in the formula,
Expected NPV (eNPV) = best case NPV × best case probability + base case NPV × base case probability + worst case NPV × worst case probability
= 99,000 × 0.5 + 36,000 × 0.3 + 27,000 × 0.2 = $657000
The eNPV of Jennifer’s investment is $65700. Based on the eNPV value, Jennifer can decide to either invest in the stock or reject it.
Risk-Adjusted NPV Vs. NPV
When evaluating investment opportunities, both Net Present Value (NPV) and Risk-adjusted NPV serve as valuable tools. However, they differ significantly in their approach towards incorporating risk into investment analysis. Below are critical distinctions between Risk-adjusted NPV and NPV:
- Risk-adjusted NPV considers the risk associated with a project. In comparison, net present value does not account for any uncertainty.
- Risk-adjusted NPV is generally regarded as a more accurate and reliable measure of cash flow since it explicitly addresses the impact of risk on the project’s expected value. Different from this, NPV provides a straightforward measure of a project’s profitability but may overlook the nuances of risk, potentially leading to less accurate assessments.
- In risk-adjusted NPV, a risk-adjusted return or cut-off rate is implied. In contrast, an average cut-off rate is used in traditional NPV.
Frequently Asked Questions (FAQs)
What is the difference between risk-adjusted NPV and risk-adjusted internal rate of return?
The risk-adjusted NPV determines the cash flow after accounting for all possible risks associated with an investment. In contrast, the risk-adjusted internal rate of return defines the profit probability of investments. The former uses dollar amount representation, whereas the latter uses percentage value representation.
Why is the discount rate important in the risk-adjusted NPV?
The discount rate is correlated with the associated risk. In finance, the higher the risk linked tends to offer higher potential returns and vice versa. The risk is also equivalent to the return, and an investor must ensure that they have the required risk appetite to suffer losses if any of the potential risks occur in the investment.
What are the limitations of risk-adjusted NPV?
One of the critical limitations of the risk-adjusted NPV is that the method of determining the risk premium needs to be clarified. There are multiple ways of deriving the expected NPV based on the time factor, and analysts can calculate the maximum risk premium. However, the project will still get approved, regardless of whether it is approved.