


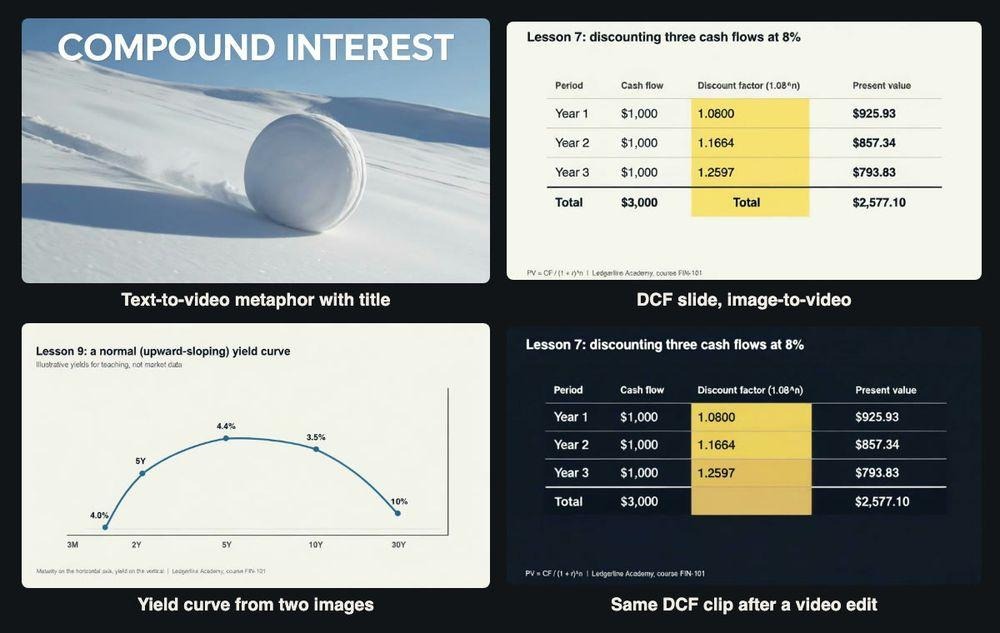
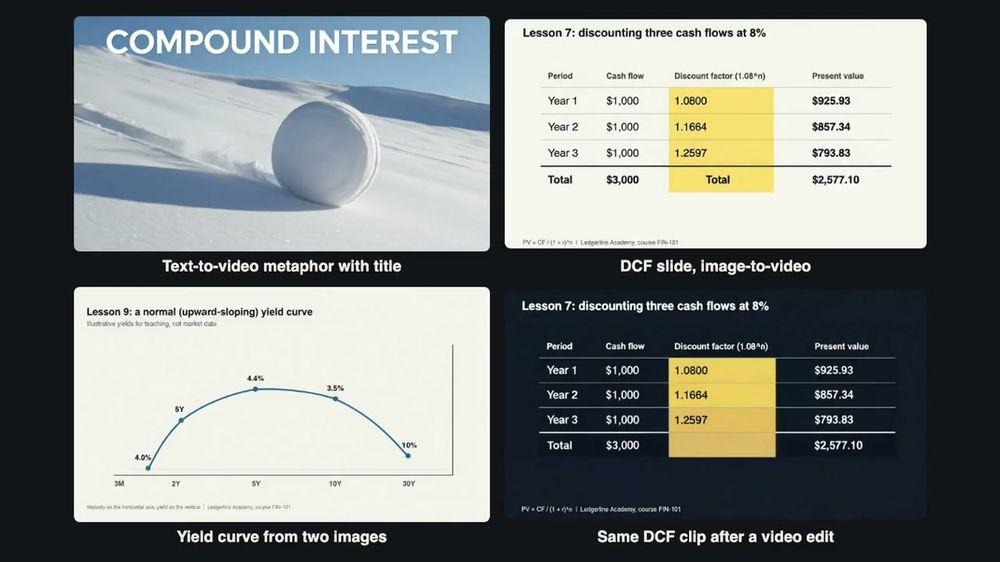
Frames from four of the nine test clips. The course, its slides and every number on them are invented for teaching.
A static chart of compound growth is correct, but students scroll past it. A short animated clip holds attention, and it costs time or money most course creators do not have. AI video models offer to close that gap: upload the slide, describe the motion, get a clip back in about a minute. For finance content there is a catch that matters more than how pretty the result is. If a model changes a single figure on a discounting table, the clip is not just ugly. It teaches the wrong answer.
Image-to-video generation is a kind of AI video model that takes a still picture, such as a chart or a lesson slide, together with a short text prompt that describes the motion, and returns a few seconds of video that starts from that picture. For a finance educator the appeal is simple: the slide already exists, so the model only has to add movement. The question this article tests is whether it can do that without touching the numbers.
So I tested that directly. I set up a fictional introductory course, Ledgerline Academy’s FIN-101, and built four lesson slides of the kind I would really use: a compound interest chart, a three-step discounted cash flow (DCF) table and two versions of a yield curve. Then I ran nine jobs on xAI’s grok-imagine-video model through an API and measured whether the numbers survived in motion and what each clip cost. The whole run, including a one-second probe, was billed at $2.37.
Two notes before the results. First, nothing here is investment advice, and the yields on the yield curve slides are illustrative values I made up for teaching, not market data. Second, every claim about text in a clip comes from running 24 evenly spaced frames through the macOS Vision text recogniser and checking the misses by eye, not from looking at a thumbnail. Each test is one generation, so treat the results as things to check, not failure rates.
The lesson slides and the maths behind them
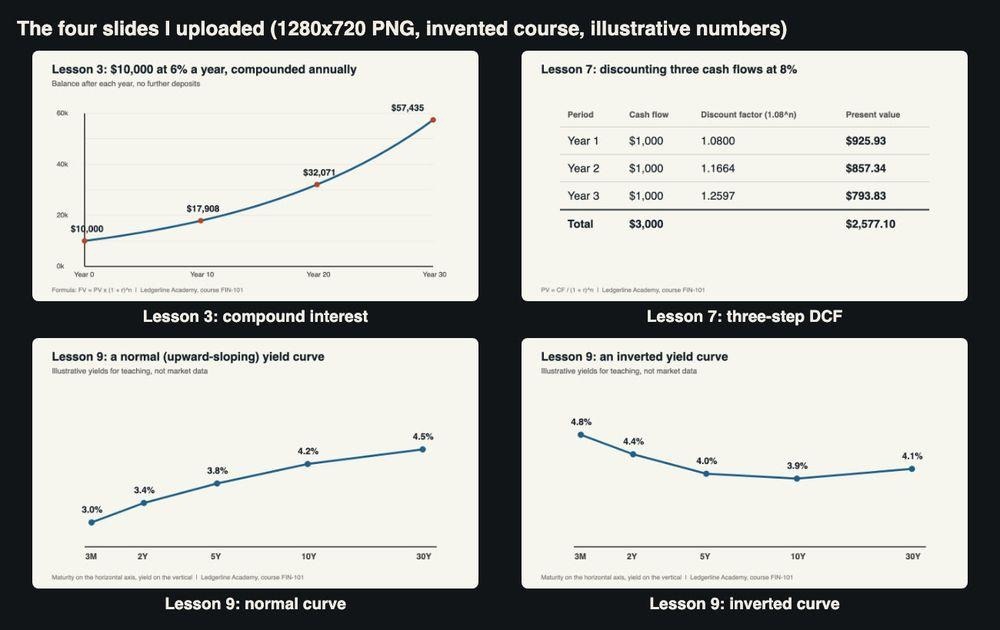
The four 1280×720 slides I uploaded as input images.
Because the test is about accuracy, the slides had to be correct to begin with. Lesson 3 shows $10,000 growing at 6% a year, compounded annually, using FV = PV x (1 + r)^n. The labelled points are $10,000 at year 0, $17,908 at year 10, $32,071 at year 20 and $57,435 at year 30 (1.06 to the power of 10, 20 and 30 is 1.7908, 3.2071 and 5.7435). Lesson 7 discounts three cash flows of $1,000 at 8%: discount factors of 1.0800, 1.1664 and 1.2597 give present values of $925.93, $857.34 and $793.83, for a total of $2,577.10 against $3,000 of undiscounted cash. Lesson 9 shows a normal curve (3.0% at three months rising to 4.5% at 30 years) and an inverted one (4.8% at three months falling to 3.9% at ten years, then 4.1% at thirty).
How the requests work
The API is asynchronous. You post a job with the model name, a prompt, a duration from 1 to 15 seconds, a resolution of 480p or 720p and an aspect ratio. Adding public image URLs in image_urls turns it into image-to-video; leaving them out gives text-to-video; passing a source clip in video.url turns it into an edit. You get a task ID back, poll it until the status is completed, and download the MP4 from a link that expires, so save it promptly. Below is a simplified version of the script I ran, with a placeholder host. The real one also logged every task ID before polling, so a dropped connection could never make me pay for the same job twice.
import os, time, requests
BASE = os.environ[“VIDEO_API_BASE”] # placeholder host
H = {“Authorization”: “Bearer ” + os.environ[“VIDEO_API_KEY”]}
def lesson_clip(prompt, slide_url=None, seconds=6, res=”480p”, ratio=”16:9″):
job = {“model”: “grok-imagine-video”, “prompt”: prompt,
“duration”: seconds, “resolution”: res, “aspect_ratio”: ratio}
if slide_url:
job[“image_urls”] = [slide_url] # omit the field for text-to-video
r = requests.post(f”{BASE}/v1/videos/generations”, headers=H, json=job, timeout=60)
task_id = r.json()[“data”][0][“task_id”]
while True:
t = requests.get(f”{BASE}/v1/tasks/{task_id}”, headers=H, timeout=30).json()[“data”]
if t[“status”] in (“completed”, “failed”, “cancelled”):
return t # t[“result”][“videos”][0][“url”][0], t[“cost”]
time.sleep(8)
Generation was quick. With eight jobs submitted at once, the task-reported times ran from 22 to 84 seconds. Every clip came back as H.264 at 24 frames per second with an AAC audio track, which I strip for lessons. Text-to-video at 480p gave 848×480; image-to-video at 480p from my 1280×720 slides gave 736×400.
Test 1: a metaphor and a title, no slide
Before touching a chart, I tried the classic teaching metaphor for compounding, with text in the shot:
A small snowball rolls down a gentle snowy slope and grows larger with every turn, picking up more snow, bright winter morning, smooth tracking shot. Large clean white title text at the top of the frame reads: COMPOUND INTEREST
Six seconds at 480p, 63 seconds to generate, $0.24. The snowball rolls and grows convincingly, the light is clean, and “COMPOUND INTEREST” was read correctly in 24 of 24 sampled frames. It is usable as a lesson opener, and it carries no numbers, which is exactly why it is safe.
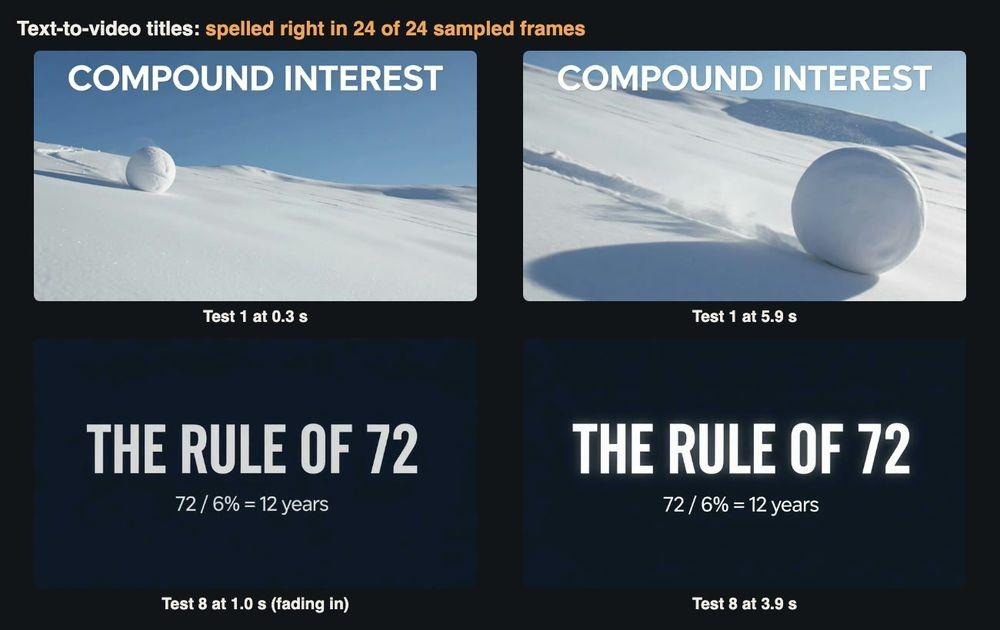
Tests 1 and 8: both titles were spelled correctly in every sampled frame.
Tests 2 and 3: animating the compound interest chart
For Test 2 I uploaded the Lesson 3 chart and asked for the most natural animation a teacher would want:
Animate this finance chart: the blue line draws itself from left to right and each red dot appears as the line reaches it. Static camera. Keep every number, word and label exactly as it is; add no new text.
The line did not draw itself; it was complete from the first frame, and the model added red drop lines under two points instead. The four balance labels ($10,000, $17,908, $32,071 and $57,435) were read in all 24 frames, so the headline figures held. The y-axis did not. From about 0.6 seconds in, “40k” became “$20k”, “20k” became “$60k” and “0k” picked up a dollar sign. A student now sees $60k below $20k. Across all twelve labels on the slide, the exact-match rate was 74.3%. Cost: $0.2416 (six seconds plus one reference image), 33 seconds.
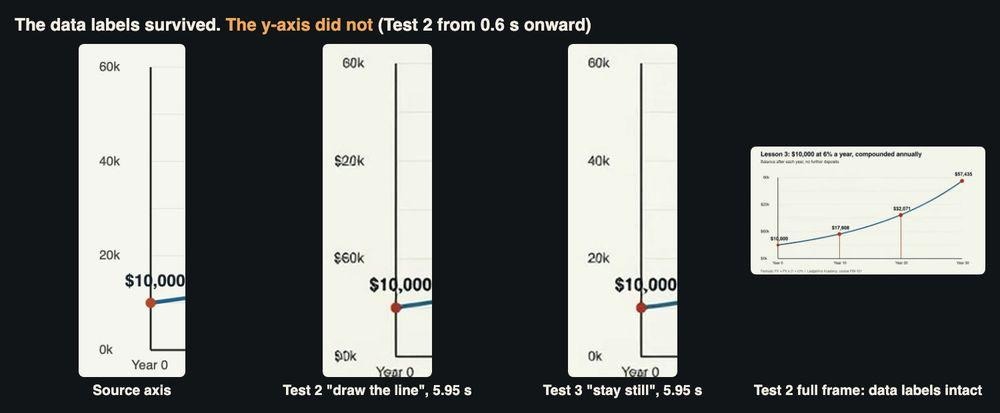
The y-axis in the source, in Test 2 and in Test 3. Only the “keep still” prompt left it alone.
Test 3 used the same slide with a much smaller request: the chart stays completely still and only the four red dots pulse, one after another. That clip kept every label. The text recogniser missed a value in two frames, but in both cases it had read the dollar sign as an “S”; the pixels were unchanged when I checked. This is the clip I would publish. The less the model has to redraw, the less it rewrites.
Test 4: the DCF table at 480p
Tables are where finance lessons live. I asked for a yellow highlight to move down the Present value column, row by row, ending on the total. All eight figures in the table body ($925.93, $857.34, $793.83, $2,577.10, the three discount factors and $3,000) were read correctly in 24 of 24 frames.
The clip still failed. The highlight ran down the Discount factor column, not Present value. Worse, the model wrote a second word “Total” into the empty discount-factor cell of the total row, and it is there in every frame. The maths is unchanged, but a careful student would ask what that cell means. It took 52 seconds and cost $0.2416.
A word on budgeting, since cost per lesson is what course creators ask about first. I took the duration, resolution, aspect ratio and price fields for every job from the parameter list and price table for the Grok Imagine image-to-video API, and checked each bill against them afterwards. At the time of my test, the listed rate was $0.04 per second at 480p and $0.056 per second at 720p, plus $0.0016 per reference image. Every generation job matched to the cent: six seconds at 480p with one slide came to $0.2416, the same with two slides to $0.2432, and six seconds at 720p to $0.3376.
Test 5: two yield curves, one transition
The model accepts several reference images, so I uploaded the normal and inverted curves and asked for the first to bend into the second, title included. This was the worst result of the day.
The very first frame was already wrong. The title and the three-month and two-year yields matched the normal slide, but 3.8% had become 4.4%, 4.2% had become 4.5% and the 30-year yield of 4.5% had become 10%. By the end the line had turned into a hump with labels of 4.0%, 4.4%, 3.5% and 10%, one point labelled “5Y” instead of a yield, and the title still said “normal”. It never resembled the inverted slide. Exact-label accuracy was 50%. Cost: $0.2432, 22 seconds, the fastest job of the run.
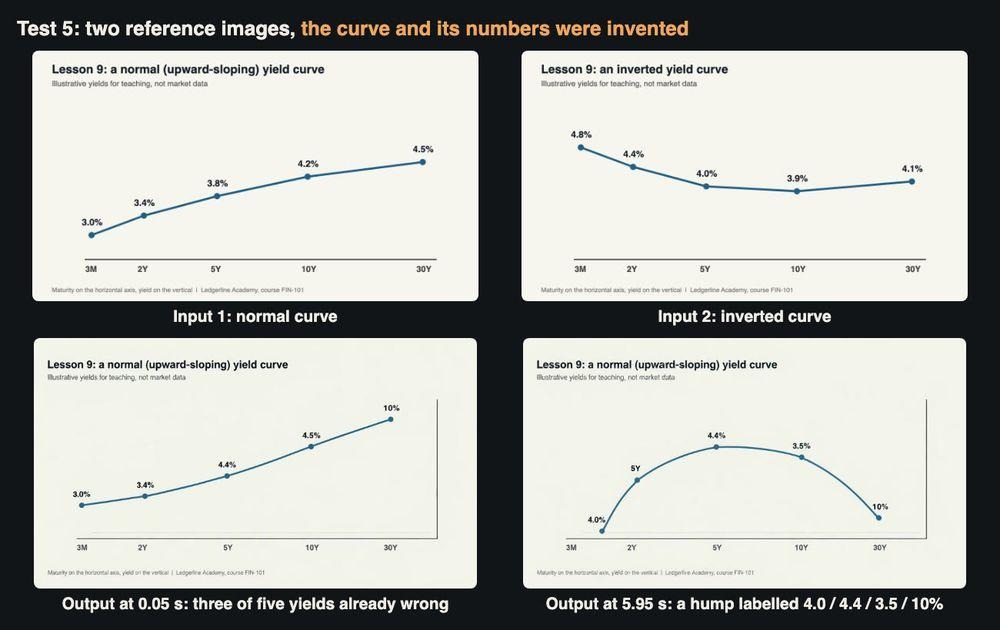
Test 5: two inputs, and an output whose curve and numbers were invented.
In a lesson on what an inverted curve signals, that teaches something false. If a curve has to change shape, animate it in the charting tool that drew it.
Test 6: a vertical version for phones
Course clips also go to short-video platforms, so I asked for the compound interest chart in 9:16 with a gentle pan from left to right. The file came back at 736×400, landscape like the input slide. The pan then slid the left edge out of view: the y-axis labels were readable in only 6 to 9 of 24 frames, and “$10,000” lost its first characters halfway through. Accuracy was 66.7%. If you need a vertical clip, make a vertical slide first.
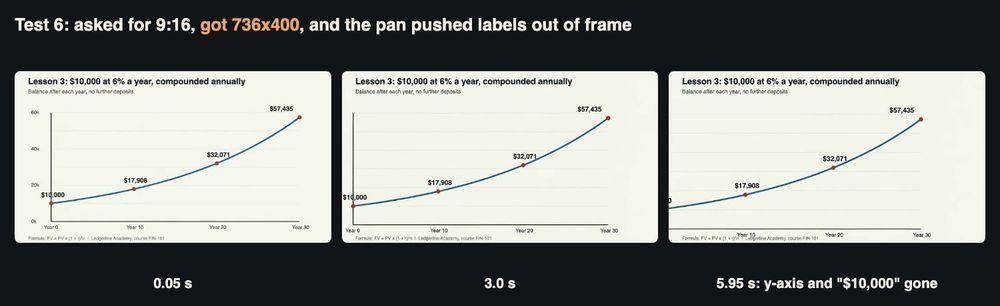
Test 6: a 9:16 request on a 16:9 slide returned a landscape clip.
Test 7: does 720p fix the table?
I reran the Test 4 prompt at 720p, my one higher-cost clip ($0.3376, 84 seconds). The picture was much sharper: the small footer, which blurred into misspellings at 480p, was readable. All eight table figures again held in every frame, and this time no extra “Total” appeared. But the 720p clip brought its own additions from the first frame: the title read “discounting three cash flows at 8%ws at 8%”, a large typeset formula appeared below the table with the exponent floating outside the bracket, and the footer was duplicated on the right. Higher resolution sharpened the text; it did not stop the model adding more.
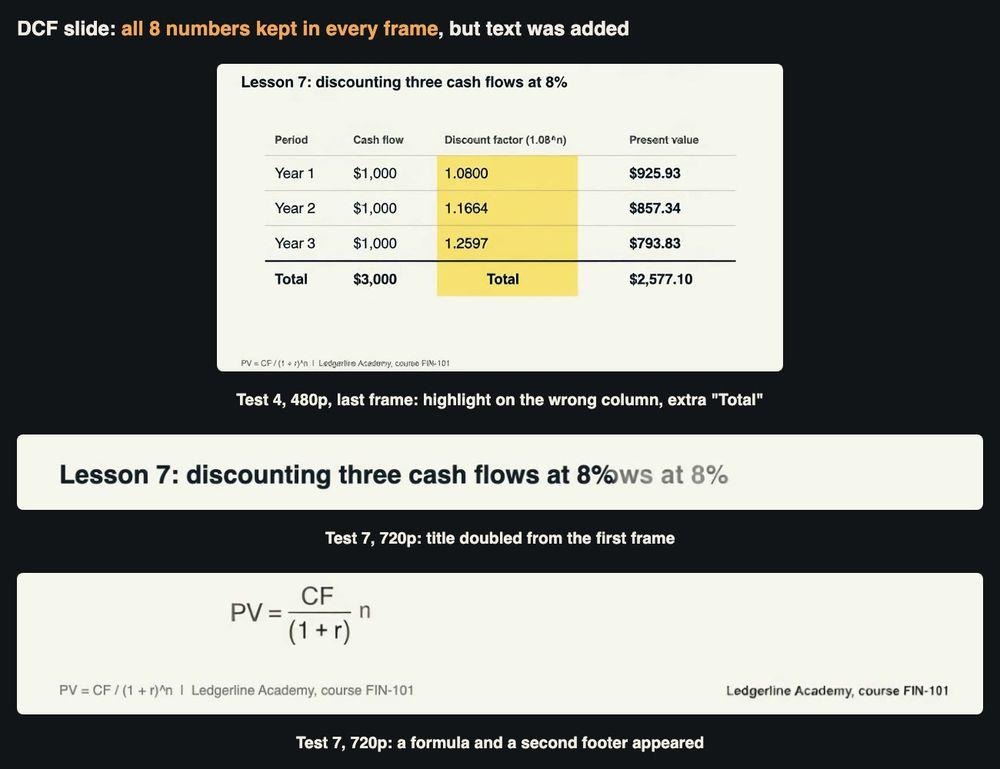
Tests 4 and 7: the numbers survived both times; the extra text differed.
Test 8: a Rule of 72 title card
Back to text-to-video, this time with a number in the title. I asked for a dark navy card reading “THE RULE OF 72” with a smaller line, “72 / 6% = 12 years”, fading in. Four seconds, $0.16, 32 seconds to generate. Both lines were read exactly in 24 of 24 frames. The arithmetic is right too: at 6%, money roughly doubles in 12 years.
Test 9: editing a clip instead of regenerating it
The base model can also edit an existing clip, so I tried to rescue Test 4. I sent the Test 4 output back with an instruction to switch to a dark theme (navy background, white text and lines) and to keep every number and the highlight movement. The edit took 74 seconds and was billed at $0.384, more than a fresh 480p clip. The result was the best table clip of the day. The numbers held (99.4% exact; the only misses were two frames where the moving highlight crossed “1.0800” and “1.1664”), the duplicate “Total” was gone. The highlight still sits on the discount-factor column, which I can live with.
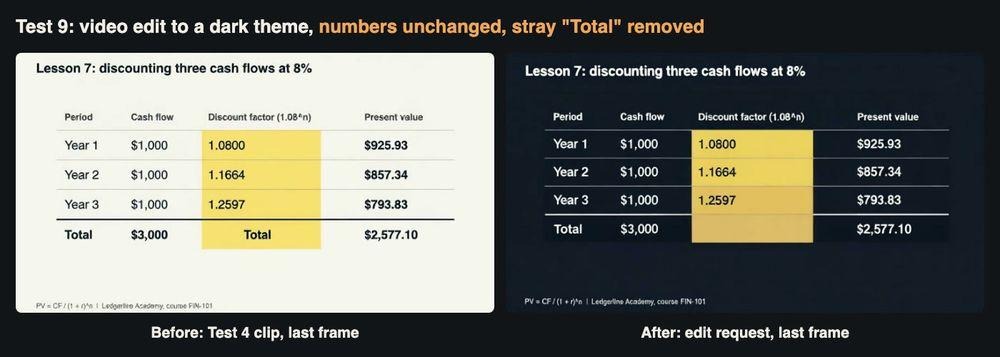
Test 9: the edit kept the figures and removed the stray word.
What a lesson clip really costs
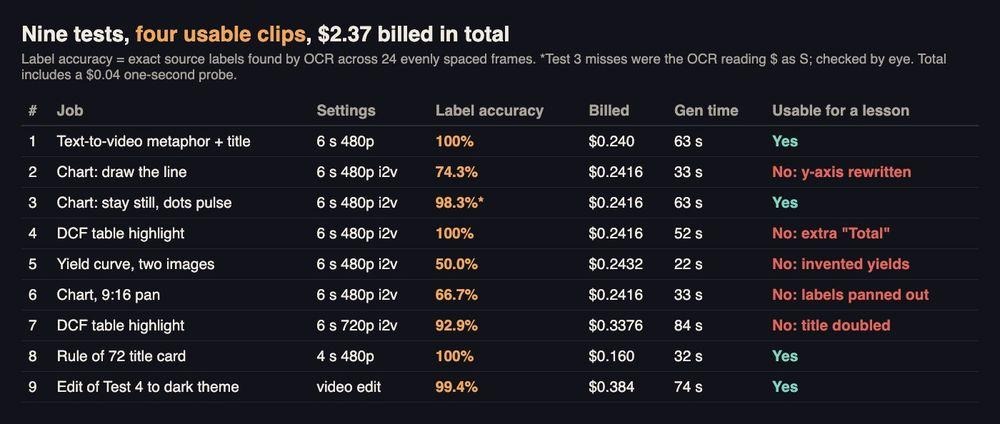
All nine tests side by side.
Four of the nine clips were good enough for a student to see: the snowball opener, the still chart with pulsing dots, the Rule of 72 card and the edited DCF table. Divide the $2.37 bill by four and a usable clip cost about $0.59. For planning, a typical lesson package of a 4-second title card, a 6-second metaphor and one 6-second slide animation at 480p comes to about $0.64 at the listed rate, before any retries. The real cost is checking time, and for finance material it is not optional.
A 2-minute narrated walkthrough of the nine tests with the generated clips. All footage in it is AI-generated.
A checklist for finance educators
- Ask for less motion on data slides. “Stay still, pulse the dots” kept every label; “draw the line” rewrote the axis.
- Never ask the model to change a chart’s shape or values. The yield curve transition invented yields from the first frame.
- Check axes and empty cells, not only the headline numbers. The main figures survived in most tests; the errors were in the axis and in blank space.
- Use text-to-video for titles and metaphors. Both title tests were spelled correctly in every frame.
- Make vertical slides for vertical clips. The aspect ratio followed the input image.
- Try an edit before a regeneration. It removed the stray word and kept the numbers.
- Run a text recogniser over sampled frames. It took seconds and found the axis error a glance would miss.
- Label the clip as AI-generated and keep the static slide in the course notes, so students always have the figures in a form that cannot drift.
The bottom line
Grok Imagine can turn finance teaching slides into short clips for well under a dollar each, and when it is asked only to add light motion to a slide it keeps the numbers intact. It becomes unreliable as soon as the job asks it to redraw something that carries meaning: an axis, a curve, a column, a title that has to change. For a finance course that sets a clear division of labour. Let the model handle openers, metaphors and gentle emphasis, keep every figure under your own control, and check each frame before a student sees it.
Frequently Asked Questions
Can AI video keep the numbers on a finance slide correct?
Mostly, if you ask for very little motion. When the prompt only asked the dots on a chart to pulse, 98.3% of the labels read correctly across the sampled frames, and the only misses were the text recogniser reading a dollar sign as an S. When the prompt asked the model to draw the line, it rewrote the axis values.
How much does one short lesson clip cost?
A 6-second clip at 480p was billed about $0.24 in these tests, and the 720p version about $0.34. Because only four of nine clips were usable as they came, the real cost per usable clip was closer to $0.59.
Can I get a vertical clip for phones from a landscape slide?
Not by changing the setting alone. With a landscape slide as the input, a 9:16 request still came back landscape. Design a vertical version of the slide first and use that as the input image.
What should I check before showing a clip to students?
Check every axis label, every figure and any empty cells, not just the headline number, and label the clip as AI-generated. Keep the static slide in the course notes so the correct figures are always available.