What is ABC Analysis?
ABC analysis refers to the inventory management technique used to identify items that constitute a significant part of the overall inventory value and categorize them into critical, important, and moderately important. This allows managers and decision-makers to prioritize their inventories and other materials according to the immediate needs of their business.
The basic premise of ABC analysis is that every single item in an inventory doesn’t have equal value and demand – some items cost much more than others. In contrast, some items are used more frequently, and the remaining are a mix of both. Therefore, categorizing them according to these parameters based on inventory ABC analysis gives businesses a clearer view of their standpoint.
ABC Analysis Explained
ABC analysis is an analytical tool classifies items or activities into three distinct categories based on their significance and impact. It guides investors and businesses through the labyrinth of financial decision-making.
The ‘A’ category encapsulates high-priority elements, representing the crux of financial success or failure. These could be high-value investments, critical business processes, or key clients demanding meticulous attention. The ‘B’ category includes items of moderate importance, while the ‘C’ category comprises low-impact elements.
This categorization enables the efficient allocation of resources and efforts. The ‘A’ items necessitate vigilant scrutiny, demanding a lion’s share of attention and resources. Meanwhile, the ‘B’ and ‘C’ items, though essential, can be managed with a more streamlined approach. This method ensures that crucial facets of finance receive the focus they deserve, preventing oversight or neglect that may lead to adverse financial consequences.
ABC Analysis audit thus becomes an indispensable tool for financial managers, providing clarity in prioritization and resource allocation. It empowers them to optimize their efforts, focusing on what truly matters and driving financial success with a discerning eye on the factors that significantly impact the bottom line. In essence, it is a strategic compass steering financial decision-makers towards efficiency and success in a complex and dynamic financial landscape.
How to Perform?
Typically, companies use the following steps to perform ABC analysis –
Step 1: Firstly, determine the items’ inventory value by multiplying their price and consumption volume during the given period. Mathematically,
Inventory Value = Item Cost * Consumption Volume
Step 2: Next, sort all the items according to inventory value from highest to lowest.
Step 3: Next, calculate the value contribution of each item as a percentage of the total inventory value. Mathematically,
Item % of Total Inventory Value = Item’s Inventory Value / Total Inventory Values
Step 4: Finally, group all the items according to their contribution to the overall inventory value. For instance, items that account for 80% of total inventory may be allocated to the category ‘A’ items. In comparison, items that account for the following 15% may be allocated to category ‘B,’ and the remaining 5% may be allocated to category ‘C.’
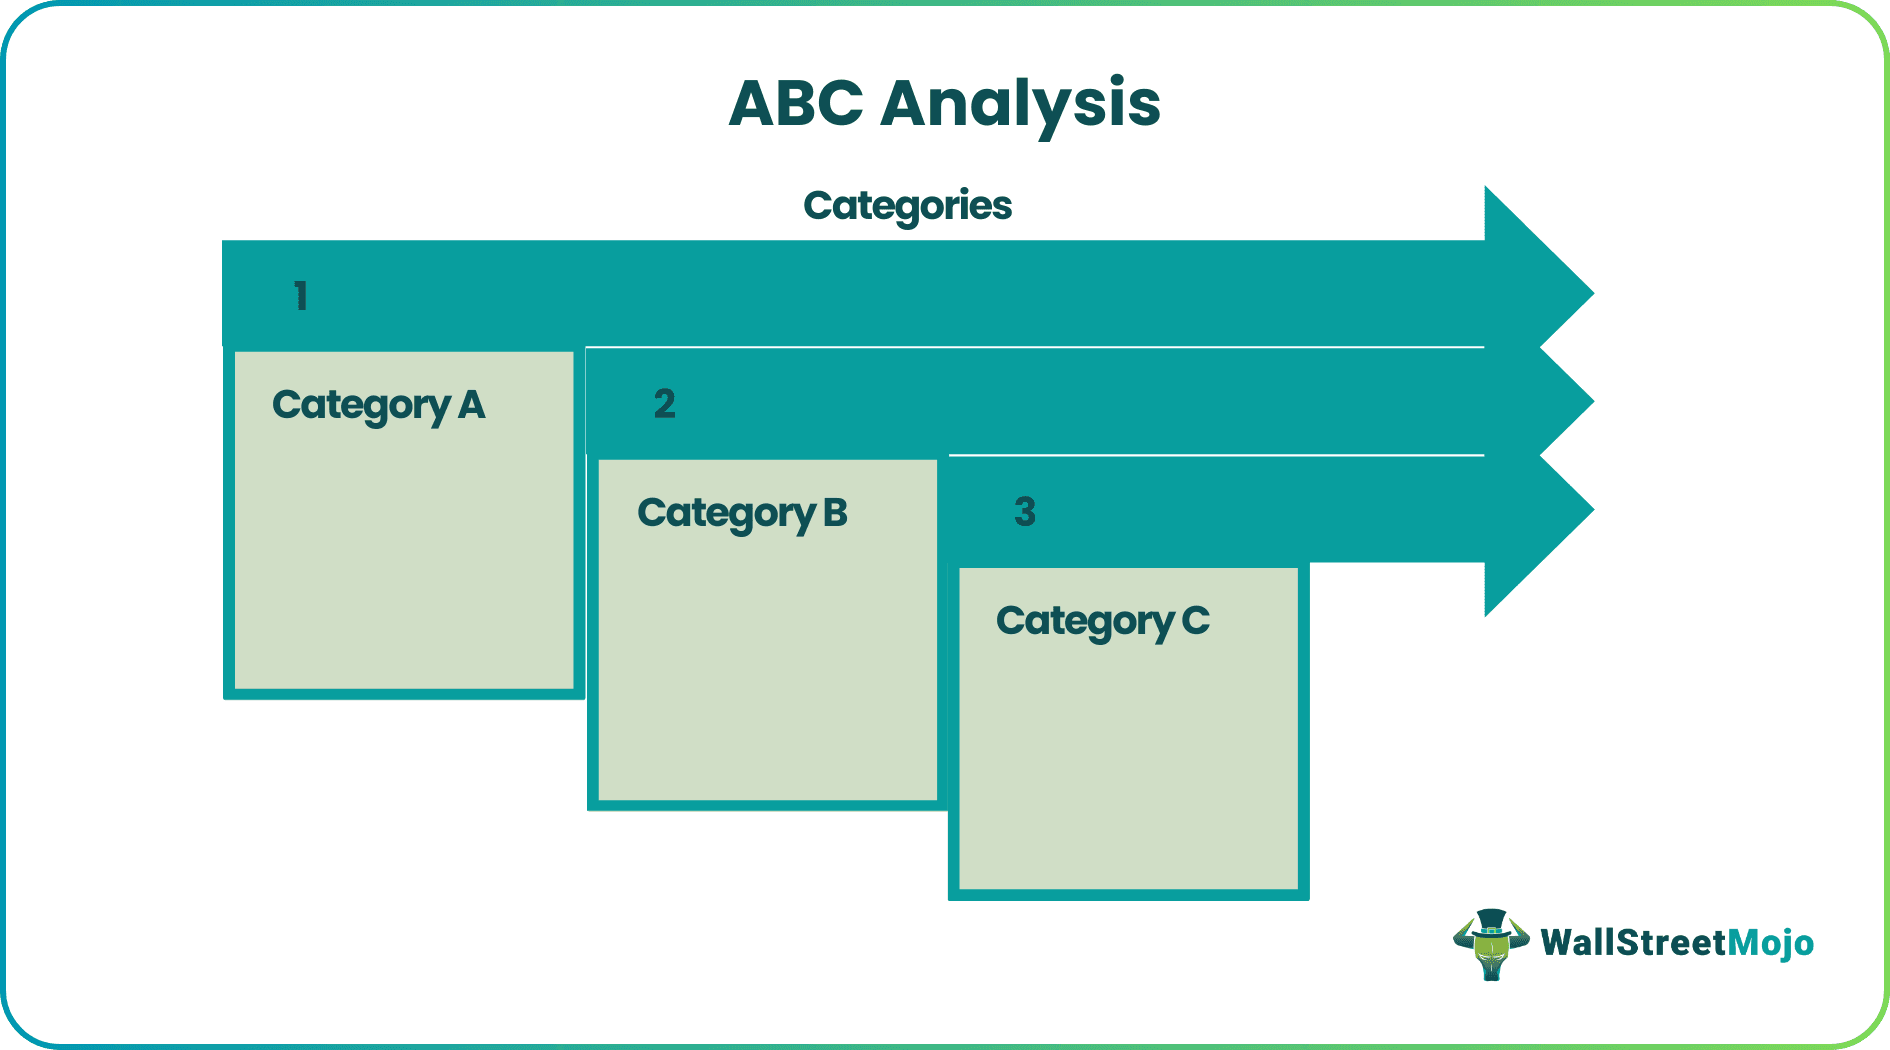
Classification
Inventory ABC analysis classifies the inventory into three categories – Category A, Category B, and Category C.
- Category A: Items in this category are essential and, sometimes, business-critical for a company. Typically, these items either have a high value or a large market. Hence, this category requires frequent value analysis.
- Category B: Items in this category are important, but not as important as those in category A. Typically, these items constitute mid-range in inventory value and have relatively lesser market demand.
- Category C: Items in this category are marginally important and constitute a tiny portion of the overall inventory value.
It is to be noted that there is no fixed threshold for any of these categories, and hence different value proportions can be used based on the company’s own objectives and criteria.
Example
Let us take the example of Susan, who is engaged in the retail sale of handbags. Last year, she decided to expand her product offering by including more sweater varieties in her inventory. Consequently, she purchased 30 different types of handbags instead of just 10. However, later, she realized the demand for the products was seasonal, and she had invested a lot. Hence, she decided to implement the ABC analysis in her business model to streamline the inventory.
So, Susan classified the inventory into categories A, B, and C, primarily based on their selling price and demand as mentioned below:
- Category A: The handbags that are highly in demand, generate the maximum revenue, or are trending in the current season were classified under this category of items.
- Category B: The handbags that are essential to the company, but not as much as those in category A. The demand for these handbags is probably slightly seasonal and not across the entire year. So, during the season, the sales of these items are expected to shoot up. Hence, this set of handbags can’t be neglected, hence category B.
- Category C: In this category, all those handbags that are not of high value to the company are included. The possible reasons may be a color combination, pattern, etc. Hence, these handbags are placed in category C
Graph
Let us now gather information about how the visual representation of an ABC analysis audit would look like through the explanation below.
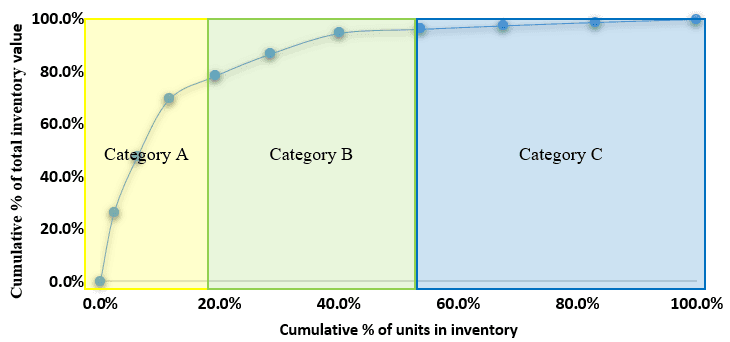
The above graph states that the items in category ‘A’ cover a small portion based on the number of units in the inventory but constitute a significant portion of the inventory value. The items in category ‘B’ have a moderate contribution to quantity and inventory value. The items in category ‘C’ cover a significant portion of the inventory in quantity but have a tiny contribution to inventory value.
Importance
Let us understand the importance of an inventory ABC analysis through the points below.
- The ABC analysis finds wide application in supply chain management and inventory management, where it used as a cycle counting system.
- It helps companies in managing their working capital requirement as well as holding costs.
- Further, it helps work out appropriate inventory rules for each item category, such as different safety stock levels and re-ordering points.
Advantages
Let us understand the advantages of ABC analysis audit through the points below.
- It provides a structured view of the entire inventory in terms of quantity and value.
- It allows management to implement different control measures for each item category.
- It helps in continuous inventory monitoring, which in turn ensures maintenance of optimum stock level.
- Focuses attention on high-priority items for optimal resource utilization.
- Identifies and mitigates risks associated with high-impact items.
- Enables targeted cost management by concentrating efforts on significant elements.
- Streamlines processes by directing attention to critical activities.
- Facilitates better inventory management by categorizing items based on importance.
- Aids in preventing oversights and minimizing financial risks.
- Provides a structured framework for prioritizing tasks and investments effectively.
Disadvantages
Despite the various advantages, there are a few points of concern from the perspective of businesses and inventory management. Let us understand the disadvantages of inventory ABC analysis through the discussion below.
- It requires a significant amount of effort to categorize items in this way.
- It is only based on the financial value of items, while it completely ignores other factors that may be important for the company.
- A large number of items keep changing their category (category A to B or B to C and vice versa) every quarter, making the analysis unstable and complicated.
- ABC analysis fails to take cognizance of basic demand patterns, such as seasonality, novelty effect, etc.·
- The choice of parameters used for ABC analysis is arbitrary.
Recommended Articles
This has been a guide to what is ABC Analysis. Here we explain how to perform it with example, graph, importance, advantages & disadvantages. You may learn more about financing from the following articles –