Part of our Data Analysis guide
What Is Data Handling?
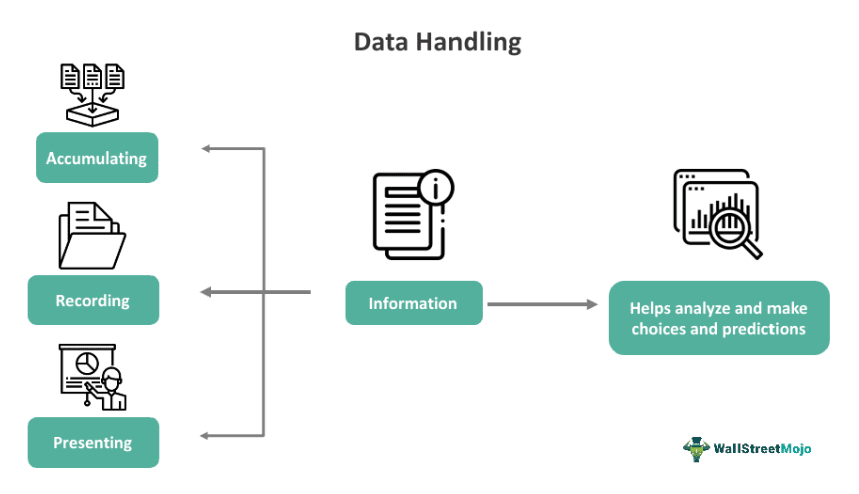
Data handling refers to a process that involves recording, presenting, and gathering information in a specific way that helps analyze and make choices and predictions. It ensures the integrity of the research data because it addresses concerns associated with security, confidentiality, and the retention or preservation of research data.

This procedure involves using two kinds of data — quantitative and qualitative. It can help present the bulk data in a definite and precise form, which is extremely useful when the given data is complex and large. There are different types of data handling. Some are pictographs, line graphs, histograms, bar graphs, and frequency distribution.
Key Takeaways
- Data handling refers to a procedure of recording, gathering, and presenting information or data in a certain manner that is meaningful and helps people analyze more easily and make conclusions faster.
- Dot plots, bar graphs, histograms, pictographs, and stem and leaf plots are a few types of data handling.
- Data management involves protecting, storing, and maintaining data. On the other hand, data handling is a procedure in which organizations or individuals present, record, and maintain data.
- Predicting trends becomes more convenient because of this procedure.
Data Handling Explained
Data handling refers to a process utilized to record, organize, accumulate, and analyze data. It aims to accumulate empirical evidence to determine whether the research findings disapprove or support the existing theories and whether they accept or reject the alternative or null hypothesis.
Simply put, this process involves accumulating a data set and presenting the same in a different format, for example, a chart or graph. This helps people easily understand the information. This procedure requires a set of skills, which include —
- Recording data with precision and accuracy
- Accumulating data utilizing a planned methodology
- Sharing data in a manner that is useful for others
- Analyzing the data and drawing conclusions
Some of the aspects that individuals must consider when carrying out this process are the type of data, ethical duties, data collection, and how they will conduct data analysis and data handling. As noted above, the data used in the process are quantitative and qualitative data. The former provides numerical information. On the other hand, the latter gives descriptive information. Note that quantitative data could be either continuous or discreet data.
Steps
The steps involved in the data handling process are as follows:
- Problem Identification: The first step in this procedure involves clearly defining and identifying the purpose or problem.
- Data Collection: In the second step, one must accumulate data relevant to the identified problem.
- Presentation Of Data: One must present the accumulated data in a way that is easy to comprehend. One can achieve this by organizing the collected data in tally marks, tables, etc.
- Graphical Representation Of Data: Next, one must graphically represent the data using charts and graphs, such as pie charts and bar graphs, to make understanding and analysis easier.
- Data Analysis: In the next step of the data handling process, data goes through analysis, which helps individuals get useful information. Such information can help take further action.
- Drawing Conclusions: Post data analysis, one must drive solutions to the problem identified by them.
Types
The different data handling techniques are as follows:
- Pictographs: These are graphs and charts that utilize images and icons to represent data.
- Bar Graphs: These refer to pictural representations of data utilizing columns, strips, or bars. One can use them to track alterations over time or compare different aspects or things between multiple groups.
- Dot Plots: This technique involves grouping the total number of data points within a data set on the basis of each point’s value. One can use them for univariate, continuous, and quantitative data.
- Histograms: A histogram refers to a graph showing numerical data’s frequency utilizing rectangles. It can summarize continuous or discreet data gauged on an interval scale.
- Cumulative Graphs And Tables: Cumulative graphs show alteration in growth and the overall (cumulative) number by duration, for example, quarter or month. On the other hand, cumulative tables are charts showing the mode or popularity of a specific data type. Moreover, it shows the possibility of a certain event dropping under the frequency distribution.
- Stem And Leaf Plots: A stem and leaf plot refers to a specific type of table where all data values are split into a leaf and a stem. This is a technique that allows one to classify continuous or discreet variables. They look similar to bar graphs.
- Frequency Distribution: This is a visual display that presents and displays frequency counts, enabling one to interpret the information more easily. Note that frequency distributions can show relative or absolute frequencies, for example, percentages and proportions.
Examples
Let us look at a few examples to understand the concept better.
Example #1
Suppose Company ABC’s sales surged at an increasing rate for three consecutive financial years. The FY21, FY22, and FY23 sales were $326,000, $419,000, and $723,000, respectively. The companies. The data was communicated along with other vital financial data, including profits, in the form of bar charts to the top-level management. The data handling process helped the managers to understand and analyze the data easily. As a result, the managers were able to make decisions faster.
Example #2
In September 2023, ABB Robotics introduced a software platform that improves data visualization, analysis, and collection within automated production facilities. The organization claims that its OptiFact platform is going to cut data handling and boost production uptime by a maximum of 20%. The platform will allow users to accumulate, analyze, and manage data from various factory devices, including the ABB robots, for determining key performance indicators (KIPs), including overall equipment efficiency (OEE) and cycle times.
Advantages And Disadvantages
Let us look at some benefits and limitations of this process.
Advantages
- It allows people to present the bulk data in a definite and precise form.
- One finds it easier to draw conclusions and make comparisons because of this process.
- Through this procedure, making forecasts regarding trends becomes easier.
Disadvantages
- The statistical data could be misused.
- This process can be complex; people may find it difficult to understand.
- The data must be uniform and homogeneous.
- People may depend too much on the data presented through charts and graphs.
Data Handling vs Data Management
Data Handling
- This is a process of organizing, analyzing, and accumulating data to pull out meaningful insights.
- This process ensures the integrity of the research data.
- Its different types are bar graphs, dot plots, pictographs, etc.
Data Management
- It is a process that involves safeguarding, maintaining, and storing data for future use.
- This process aims to assist organizations and individuals in optimizing the utilization of data within the set boundaries concerning regulation and policy.
- Some types of data management are data catalogs, architecture, modeling, and security.
Frequently Asked Questions (FAQs)
How to find the range in data handling?
One can compute the range by computing the difference between the highest and lowest observations. The result obtained is the observation’s range. It represents the observation’s spread.
How to find a mode of data handling?
Computing mode is an easy procedure; one needs to follow these steps:
– Place every number of a specific set in order, for example, highest to lowest or lowest to highest.
– Count the total number of times every number appears in that particular set.
The number appearing the most number of times in the given set is the mode.
What are tally marks in data handling?
Tally mark graphs or charts refer to a graphical representation of data in statistics. It helps in scanning the data and finding the frequency for a certain data set. The first four tallies are vertically marked, while the fifth tally is marked diagonally across the vertically marked tallies.
How to find the average in data handling?
One can find the mean or average of a particular data set by computing the sum of every number within the data set and then dividing the result by the total number of values within that set.
Recommended Articles
This article has been a guide to what is Data Handling. Here, we explain its types, examples, advantages, disadvantages, and differences with data management. You may also find some useful articles here –
Recommended Articles
Continue with these closely related articles from the same guide.