What is EBITDA Margin?
EBITDA Margin calculates how much of the EBITDA (earnings before interest depreciation and amortization) is generated as a percentage of Sales. EBITDA is found after deducting operating expenses (like Cost of Goods Sold, Selling General and Admin Costs, etc.) from the Total Sales.
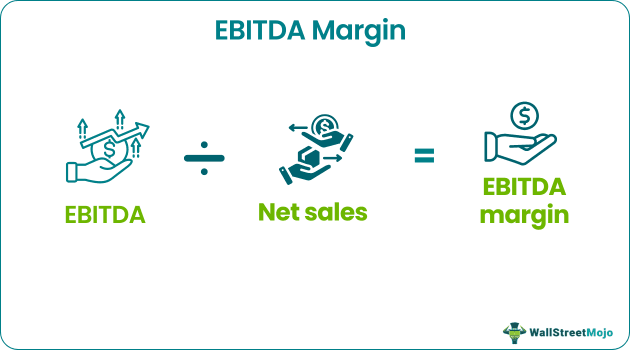
EBITDA Margin equation is the operating profitability ratio, which is helpful to all stakeholders of the company to get a clear picture of operating profitability and its cash flow position and is calculated by dividing the earnings before interest, taxes, depreciation, and amortization (EBITDA) of the company by its net revenue.
EBITDA Margin Explained
The EBITDA margin, or Earnings Before Interest, Taxes, Depreciation, and Amortization margin, is a financial metric that assesses a company’s operating profitability by examining its ability to generate income from core operations. EBITDA is derived by adding back interest, taxes, depreciation, and amortization to net income, providing a clearer picture of operational efficiency and performance.
The EBITDA margin calculation is expressed as a percentage and is calculated by dividing EBITDA by total sales. This margin offers insights into how well a company’s operational activities are generating profits relative to its overall sales. A higher EBITDA margin indicates stronger operational efficiency and profitability.
This metric is particularly valuable for investors, analysts, and creditors as it eliminates the impact of non-operating factors, providing a more focused view of a company’s ability to generate cash from its primary business operations. Industries with high capital expenditures, such as manufacturing or telecommunications, often use EBITDA margin to assess profitability without the influence of substantial depreciation expenses.
However, it’s essential to note that while EBITDA margin is a useful tool for evaluating operational efficiency, it does not account for changes in working capital, capital expenditures, or other non-operating cash flow items.
Therefore, it should be considered alongside other financial metrics for a detailed assessment of a company’s financial health and performance. Despite its limitations, the EBITDA margin remains a widely utilized measure in financial analysis due to its ability to isolate operating profitability and offer valuable insights into a company’s core financial performance.
Formula
Let us understand the formula that shall act as the basis of our understanding of EBITDA margin equation through the discussion below.
To Calculate EBITDA Ratio, you can use the below formula
When we drill down:
- EBI = Earnings Before Interest Expense
- T = Taxes
- D = Depreciation
- A = Amortization
EBITDA Margin Video

Examples
Now that we understand the basics and intricacies of EBITDA margin calculation and implication, let us also touch upon the practicality of the concept through the examples below.
Example #1
Let us see the EBITDA Margin calculation of Starbucks.
Below is the Income Statement snapshot of Starbucks Corp. We note that Earnings Before Interest Taxes Depreciation and Amortization is not directly provided in the income statement.
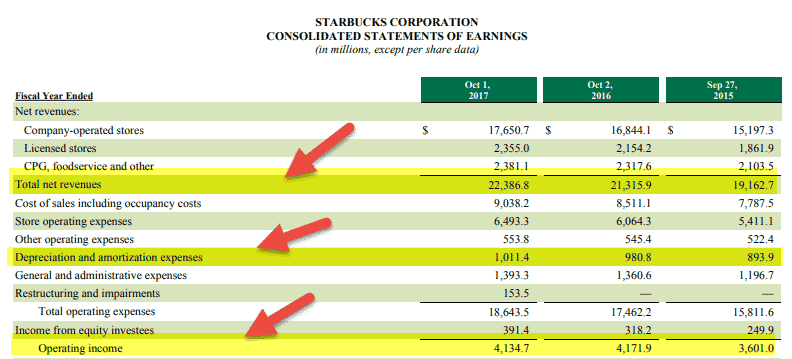
Source: Starbucks SEC Filings
2017
- EBITDA (2017) = EBIT (2017) + Depreciation and Amortization (2017) = $4,134.7 + $1,011.4 = $5,146.1 million
- EBITDA Margin Formula (2017) = EBITDA (2017) / Sales (2017) = 5146.1/22,386.8 = 22.98%
2016
- EBITDA (2016) = EBIT (2016) + Depreciation and Amortization (2016) = $4,171.9 + $980.8 = $ 5,152.7 million
- EBITDA Margin Formula (2016) = 5,152.7/21,315.9 = 24.17%
2015
- EBITDA (2015) = EBIT (2015) + Depreciation and Amortization (2015) = $3,601.0 + $893.9 = $ 4,494.9 million
- EBITDA Margin Formula (2015) = 4,494.9/19,162.7 = 23.45%
Example #2
In Colgate’s Income statement, we are provided with the Operating Profit numbers, i.e., EBIT. However, we are not provided with Depreciation and Amortization costs as a separate line item. It is because depreciation and amortization is included in the cost of sales and Selling admin and General Expenses.
Let us take another example of EBITDA Margin calculation

source: Colgate SEC Filings
Therefore, we need to move to the cash flow statements to identify the Depreciation and Amortization figures, which we can add back to EBIT to find EBITDA.

source: Colgate SEC Filings
EBITDA = EBIT + Depreciation and Amortization
- EBITDA (2017) = 3589 + 475 = $4064 million
- EBITDA Margin (2017) = 4064 / 15454 = 26.3%
- EBITDA (2016) = 3837 + 443 = $4280 million
- EBITDA Margin (2016) = 4280 / 15195 = 28.2%
Why is EBITDA Margin important?
Let us understand why this metric has been so popular among stakeholders of a business and analysts alike for a considerable period of time by understanding its importance through the explanation below.
#1 – Considered to be Cash Operating Profit Margin
- It is a cash operating profit margin that does not include the effect of capital structure and non-cash items like depreciation and amortization.
- EBITDA margin calculation provides a measure of how much cash the company generates per-unit revenue. (however, cash flow from operations per unit revenue can be more precise in this context).
#2 – Removes Non-Operating Effects
- EBITDA margin calculation removes nonoperating effects that are unique to each company. For example, suppose you compare companies in the Oil and Gas sectors. In that case, each may follow different depreciation and amortization policies (straight-line depreciation policy, double declining method of depreciation, etc.). etc.). Also, their capital structures can be significantly different.
- EBITDA removes all these nonoperating effects and also helps to make a comparison between two companies.
- It is also useful for year-over-year company analysis.
# – Alternative to Net Profit Margin
- Net Profit Margin includes the effect of depreciation and amortization, interest expenses, and tax rates. However, EBITDA Margin does not affect such expenses even when the tax structures are very different.
Drawbacks
While there are numerous advantages or significance of EBITDA margin equation, there are a few factors from the other end of the spectrum as well. Let us understand them to fully understand the concept.
#1 – Window Dressing
Companies with low-profit margins may try to window dress their margin figures by highlighting EBITDA margin instead of Net Profit Margin.
#2 – EBITDA is a non-GAAP measure
Since EBITDA is a non-GAAP measure and is not regulated, some companies may use it to portray a rosy financial situation of the company.
#3 – Can be incorrectly applied
This margin should not be used to compare companies with high debt capitalizThis margin should not be used to compare companies with high debt capitalization. This is because their their interest expenses will be very high, and EBITDA margins will not capture the amount of debt. Also, if you compare two companies, one with low debt capitalization and the other one with high debt capitalization, the findings may not lead to the correct conclusions.
Industry-Wise Margin
Let us understand the industry-wise EBITDA margin calculation through the detailed discussion below. It shall give us a clear idea of the heterogeneity of margins across industries.
Apparel Industry
Below is the list of top companies in the Apparel Sector, along with their margins
| Name | Margin (TTM) | Market Cap ($ Million) |
|---|---|---|
| American Eagle Outfitters | 13.1% | 4464.8 |
| Abercrombie & Fitch | 8.4% | 1639.9 |
| Buckle | 17.9% | 1189.3 |
| Chico’s FAS | 9.9% | 1131.5 |
| DSW | 7.2% | 2224.8 |
| Guess? | 5.5% | 1823.6 |
| Gap | 12.6% | 11651.2 |
| L Brands | 17.4% | 8895.5 |
| Lululemon Athletica | 23.5% | 16468.1 |
| Children’s Place | 11.4% | 2077.5 |
| Ross Stores | 16.8% | 33685.3 |
| TJX Companies | 13.0% | 60932.3 |
| Urban Outfitters | 11.3% | 4872.1 |
- Overall, we note that the margins are not too high in the apparel sector, ranging from 10-15% on average.
- Lululemon Athletica has the highest margin in this group at 23.5%, while the lowest was that of Guess at 5.5%
Automobile Industry
Below is the list of top companies in the Apparel Sector along with their margins and Market Capitalization
| Name | Margin (TTM) | Market Cap ($ million) |
|---|---|---|
| Ford Motor | 5.1% | 39538 |
| Fiat Chrysler Automobiles | 10.8% | 33783 |
| General Motors | 16.3% | 51667 |
| Honda Motor Co | 12.0% | 53175 |
| Ferrari | 32.4% | 30932 |
| Toyota Motor | 14.9% | 192624 |
| Tesla | -3.4% | 59350 |
| Tata Motors | 10.8% | 12904 |
- We note that Tesla is unprofitable at the EBITDA Level and its margin is at -3.4%
- On the other hand, Ferrari is the most profitable with a margin of 32.4$
- Other auto manufacturers have margin in the range of 10-15% on an average
Discount Stores
Below is the list of top companies in the Discount Stores along with their margins and Market Capitalization
| Name | Margin (TTM) | Market Cap ($ million) |
| Big Lots | 7.4% | 1823 |
| Burlington Stores | 11.4% | 10525 |
| Costco Wholesale | 4.3% | 96984 |
| Dollar General | 10.2% | 26296 |
| Dollar Tree Stores | 11.7% | 21557 |
| Ollie’s Bargain Outlet | 14.0% | 4330 |
| Pricesmart | 5.8% | 2496 |
| Target | 9.2% | 43056 |
| Walmart | 5.2% | 261917 |
- We note that Walmart has the lowest Margin of 5.2% in this group
- Ollie’s Bargain Outlet, on the other hand, has the highest Margin of 14.0%
- In general (as expected), discounted stores operate at relatively lower margin levels as compared to the other sectors.
Oil & Gas
Below is the list of top companies in the Oil & Gas E&P along with their margins and Market Capitalization
| Name | Margin (TTM) | Market Cap ($ million) |
| Diamond Offshore Drilling | 24.0% | 2544 |
| Ensco | 14.0% | 3234 |
| Helmerich & Payne | 24.8% | 6656 |
| Nabors Industries | 18.7% | 2366 |
| Noble Corp | 25.9% | 1444 |
| Ocean Rig UDW | 24.3% | 2536 |
| Patterson-UTI Energy | 23.7% | 3683 |
| Rowan Companies | 41.6% | 1736 |
| Transocean | -40.5% | 5917 |
| Unit | 39.1% | 1293 |
- We note that the Margins of these oil and gas companies are generally higher at an average of 25-30%.
- Transocean is making losses with a Margin of -40.5%
- Rowan Companies is the best in the lot with a Margin of 41.6%
How To Increase?
Implementing strategies tailored to the specific industry and company context can contribute to a sustained increase in this margin, let us understand the different strategies that can be adopted by businesses through the explanation below.
- Streamlining operational costs and identifying areas for cost reduction can contribute to an increase in EBITDA margin. This includes optimizing production processes, negotiating favorable supplier contracts, and implementing efficiency measures.
- Increasing revenue while maintaining or improving cost structures directly impacts the EBITDA margin. Strategies such as expanding market share, introducing new products or services, and enhancing sales and marketing efforts can drive revenue growth.
- Enhancing overall productivity by investing in technology, automation, and employee training can lead to increased efficiency and higher margins in this regard.
- Strategic pricing and effective management of pricing structures can positively impact profitability. Ensuring that products or services are priced competitively and reflect their value in the market is crucial.
- Shifting focus towards products or services with higher profit margins can contribute to more favorable margins.
- Reducing interest expenses through debt management and refinancing initiatives can positively impact EBITDA, as it adds back interest in its calculation.
EBITDA Margin VS Gross Margin
Let us understand the differences between the EBITDA margin calculation and gross margin through the comparison below.
EBITDA Margin
- It evaluates a company’s overall profitability by considering earnings before interest, taxes, depreciation, and amortization.
- Reflects the efficiency of a company’s core operations in generating profits without the impact of non-operating factors.
- Provides a holistic view of profitability, including both variable and fixed operating costs.
- Investors and analysts often use this margin to assess a company’s operational health and its ability to generate cash from core business activities.
Gross Margin
- Gross margin focuses specifically on production-related profitability by subtracting only the cost of goods sold (COGS) from revenue.
- It is useful for assessing the profitability of individual products or services, helping in pricing decisions, and product mix optimization.
- It does not consider fixed operating costs such as administrative expenses or overheads, offering a narrower perspective on profitability.
- Particularly relevant in industries with high variable production costs, such as manufacturing or retail.
Recommended Articles
This article has been a guide to what is EBITDA margin. Here, we discuss its formula, examples, drawbacks, and compare it with gross margin in detail. You can learn more about Ratio analysis here –