Table Of Contents
What Is Correlation Coefficient?
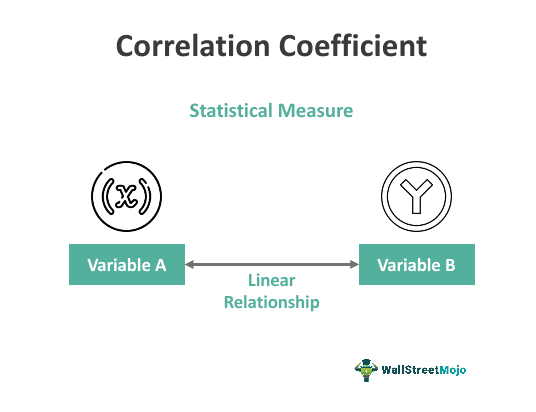
The correlation coefficient is a standard measure which defines how any two variables correlate to each other or how they move together. It is expressed in the form of a ratio of sample covariance to the product of the standard deviation of two variables.

The correlation coefficient determines how strong the relationship between two variables is. Its values range from -1.0 to 1.0, where -1.0 represents a negative correlation and +1.0 represents a positive relationship. It considers the relative movements in the variables and then defines if there is any relationship between them.
Correlation Coefficient Explained
The correlation coefficient is a metric used in statistics which evaluates the strength of the relation between the movement of two variables. The strength of such a relation is exhibited in a linear form, whose value remains within a particular range, namely -1 to +1. It has a wide usage in the field of financial management and scientific research.
Apart from two variables, we can use it to define the strengths between two factors or two sets of data. In the financial market, this metric often explains the relation between prices of commodities and their respective returns. There are various types of models available for the same whose selection also depends on the type of application.
Most commonly used method for rank correlation coefficient is the Pearson Coefficient. However, it is unsuitable for data sets that are not linear in nature. It also does not differentiate between independent and dependent variables.
In simple words, it is an idea that made its way through sampling. In the process, it is necessary to determine the standard deviation and covariance and then put the respective values in the formula to get the result.
Properties
Some important properties of the concept of rank correlation coefficient are as given below:
- For any two random variables, X and Y, the value will fall within the range of -1 and +1. So they will always be more than -1 and less than +1.
- A correlation of zero means there is no correlation between the two variables.
- A positive and negative correlation indicates a positive and negative correlation respectively.
- It is possible to use graphical representation for interpreting correlation coefficient like scatter diagram to show the results of the calculation for visual interpretation. Thus, scatter plot is a very useful tool in this case.
Formula
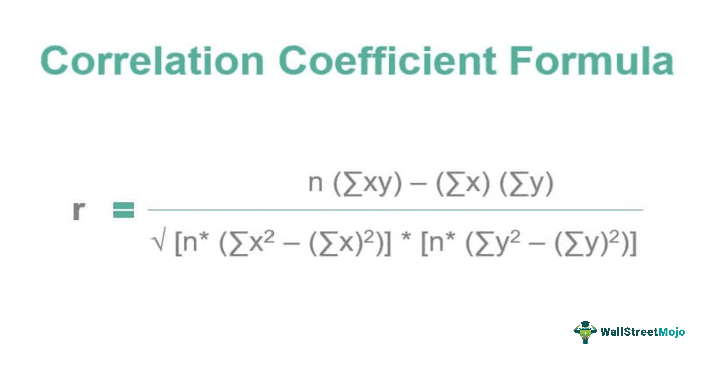
Let us understand the formula used in the process, as given below:
r = n (∑xy) - ∑x ∑y / √ *

Where
- r = correlation coefficient
- n = number of observations
- x = 1st variable in the context
- y = 2nd variable
As the above formula states, the calculation starts with the determination of the standard deviation of each variable and then the covariance. As we know, the standard deviation measures how much the data points have deviated from its mean or average. The covariance in the denominator helps us to understand whether the variables are moving in the same direction or not. Through the above formula, we understand how strongly the two measures are related to each other.
Suppose there is any correlation or relationship between two variables. In that case, it shall indicate if one variable changes in value, then the other variable will also tend to change in value, say in specific, which could be either in the same or opposite direction. The numerator part of the equation conducts a test and the relative strength of the variables moving together. The denominator part of the equation scales the numerator by multiplying the differences between the variables from squared variables.
Examples
We can understand the concept for interpreting correlation coefficient with the help of some suitable examples.
Example #1
Consider the following two variables, x and y. Then, you are required to calculate the correlation coefficient.
Below is given data for the calculation.

Solution:
Using the above equation, we can calculate the following:

We have all the values in the above table with n = 4.
Let’s now input the values for the calculation of the correlation coefficient.

Therefore, the calculation is as follows:

r = ( 4 * 25,032.24 ) – ( 262.55 * 317.31 ) / √ *
r = 16,820.21 / 16,831.57
The coefficient will be –

Coefficient = 0.99932640
Example #2
Country X is a growing economy country, and it wants to conduct an independent analysis of the decisions taken by its central bank regarding interest rate changes, whether those have impacted inflation, and whether the Central Bank can control the same.
The following is a summary of the interest rate and the inflation rate that prevailed in the country on average for those years are below:
Below is given data for the calculation:

The President of the country has approached you to conduct an analysis and provide a presentation at the next meeting. Use correlation and determine whether the Central Bank has met its objective.
Solution:
Using the formula discussed above, we can calculate the correlation coefficient in excel. For example, treat interest rate as one variable, say x, and treat inflation rate as another as y.

We have all the values in the above table with n = 6.
Let’s now input the values for the calculation of the correlation coefficient.


r = ( 6 * 170.91 ) – (46.35 * 22.24 ) / √ *
r = -5.36 / 5.88
The correlation will be –

Correlation = -0.92
Analysis: It appears that the correlation between the interest rate and the inflation rate is negative, which appears to be the correct relationship. As the interest rate rises, inflation decreases, which means they tend to move in the opposite direction from each other, and it appears from the above result that the central bank was successful in implementing the decision related to interest rate policy.
Example #3
ABC laboratory is researching height and age and wanted to know if there is any relationship between them. So, they gathered a sample of 1,000 people for each category and found an average height in that group.
Below is given data for the calculation of the correlation coefficient.

You are required to calculate the correlation coefficient and come up with a conclusion if any relationship exists.
Solution:
Treating age as one variable, say x, and treating height (in cms) as another variable as y.

We have all the values in the above table with n = 6.
Let’s now input the values for the calculation of the correlation coefficient.


r =( 6 * 10,137 ) – (70 * 850) / √ *
r= 1,322.00 / 1,361.23
The correlation will be –

Correlation = 0.971177099
Interpretation
Simply being able to calculate the correlation coefficient is not enough. It is also necessary to interpret the value and understand what it actually conveys. When we find that the result of correlation coefficient in excel is giving a positive value, which is more than zero, the reation is positive. It also means that the increase in the value of one variable will lead to the increase in the other too.
A strong negative correlation, in which the value will be less than zero, or negative, will denote that the increase in one will lead to decrease in the other.
Similarly, if the resultant value is zero, there is no linear relation between them. However, it can also be interpreted in the manner where, if we see that the value is further away from zero, both in the positive direction as well as negative direction, it can be assumed that the correlation is very high. It is important to note that a result with the values of -1 or +1 means the variables are perfect fit and all the data point fall under a straight line. This also indicates that they are totally correlated.
Uses
It is used in statistics mainly to analyze the strength of the relationship between the variables under consideration. It also measures if there is any linear relationship between the given sets of data and how well they could be related. One of the standard measures of correlation is the Pearson Correlation Coefficient.
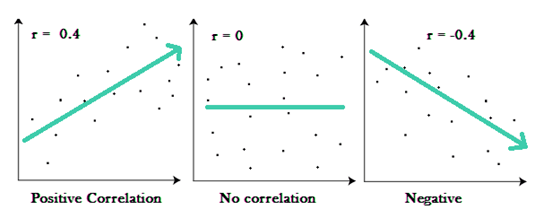
If variable changes in value along with that other variable changes in value, then understanding that relationship is critical as one can use the value of the former variable to predict the change in the value of the latter variable. A correlation has multiple usages today in this modern era, like in the financial industry, scientific research, and where not. However, it is important to know that correlation has three major types of relationships. The first one is a positive relationship, which states if there is a change in the value of a variable, then there will be a change in the related variable in the same direction. Similarly, the related variable will behave in the opposite direction if there is a negative relationship. Also, if there is no correlation, r will imply a zero value. See the below images to understand the concept better.

Correlation Coefficient Vs Coefficient Of Determination
Both the above are statistical determination or measures that are related to each other but they have different purposes of denoting the relation between two variables. Let us find out the differences.
- The correlation coefficient table determines the strength and also the direction of the linear relationship between two variables. But the latter is a measure that is used in regression analysis.
- The former shows by how much and also in which direction the variables move with each other, whereas the latter shows the level of the variance of the dependent variable that can be predicted from the independent variable.
- The former ranges between -1 and +1 whereas the latter ranges between 0 and 1.
- In case of the correlation coefficient table, +1 is perfectly positive and -1 is perfectly negative correlation, whereas for the latter, 0 indicates no variability in the dependent variable and 1 means there is perfect variability.
- The latter is actually a square of the former or a squared correlation coefficient.
Thus, the above are some important differences between the two concepts.

