What Are Market Indicators?
Market Indicators refer to the quantitative measures that traders use to for predict the stock market trends and fluctuations with the help of financial ratios and other relevant data so acquired. These present the analyst’s viewpoint on the market, and they are tools to justify their expectations of the market.
The stock or equity market indicators may not always predict the market correctly and, therefore, cannot be completely relied upon while making investing decisions. Published indicators can strengthen the analysis or even steer one back to the correct path if the results are way-off to what the indicators suggested.
Market Indicators Explained
Market indicators are used for quantitative analysis of the market trends to help traders learn about the current market trends and identify patterns to make the best investment and trading decisions. It is purely based on the interpretation of the data acquired from the market. However, it is not always necessary for these indicators to be accurate and reliable.
At times, these indicators might be wrong as well, and a contrary analysis is more justified. So ultimately, it boils down to how well the analyst can gauge the market. Though equity or stock market indicators in technical analysis are effective metrics to help in gauging the stock price movement, it cannot be the sole metric to depend on. Undoubtedly, this metric helps, but it’s better to use it as a guide and support the results with other metrics as well.
The market indicators can either be leading, lagging or coincident indicators. The leading indicators are the one that reflect changes before the expected fluctuation in the economy occur. On the contrary, the lagging indicators reflects the change after the fluctuations have occurred in the economy. Coincident indicators are those that reflect the current economic scenario and changing market trends likewise.
Traders consider these indicators to assess the economic state based on the changes that occur from time to time. As a result, they are able to make smart investment decisions. These indicators allow performing fundamental analysis, thereby helping investors understand the overall economic scenario before making any decision.
In addition, these also enable traders to analyze the stock price movements in the market by implementing technical analysis measures using these indicators. Some of the best market indicators include:
- Economic indicators – Unemployment rate, Gross Domestic Product (GDP), etc.
- Technical indicators – Moving Averages, Relative Strength Index (RSI), Bollinger Bands, etc.
- Sentiment indicators – Volatility Index (VIX), Bull/Bear Ratio, etc.
Many traders use Saxo Bank International to research and invest in stocks across different markets. Its features like SAXO Stocks offer access to a wide range of global equities for investors.
Types
Following is a broadway of categorizing the Market Indicators:
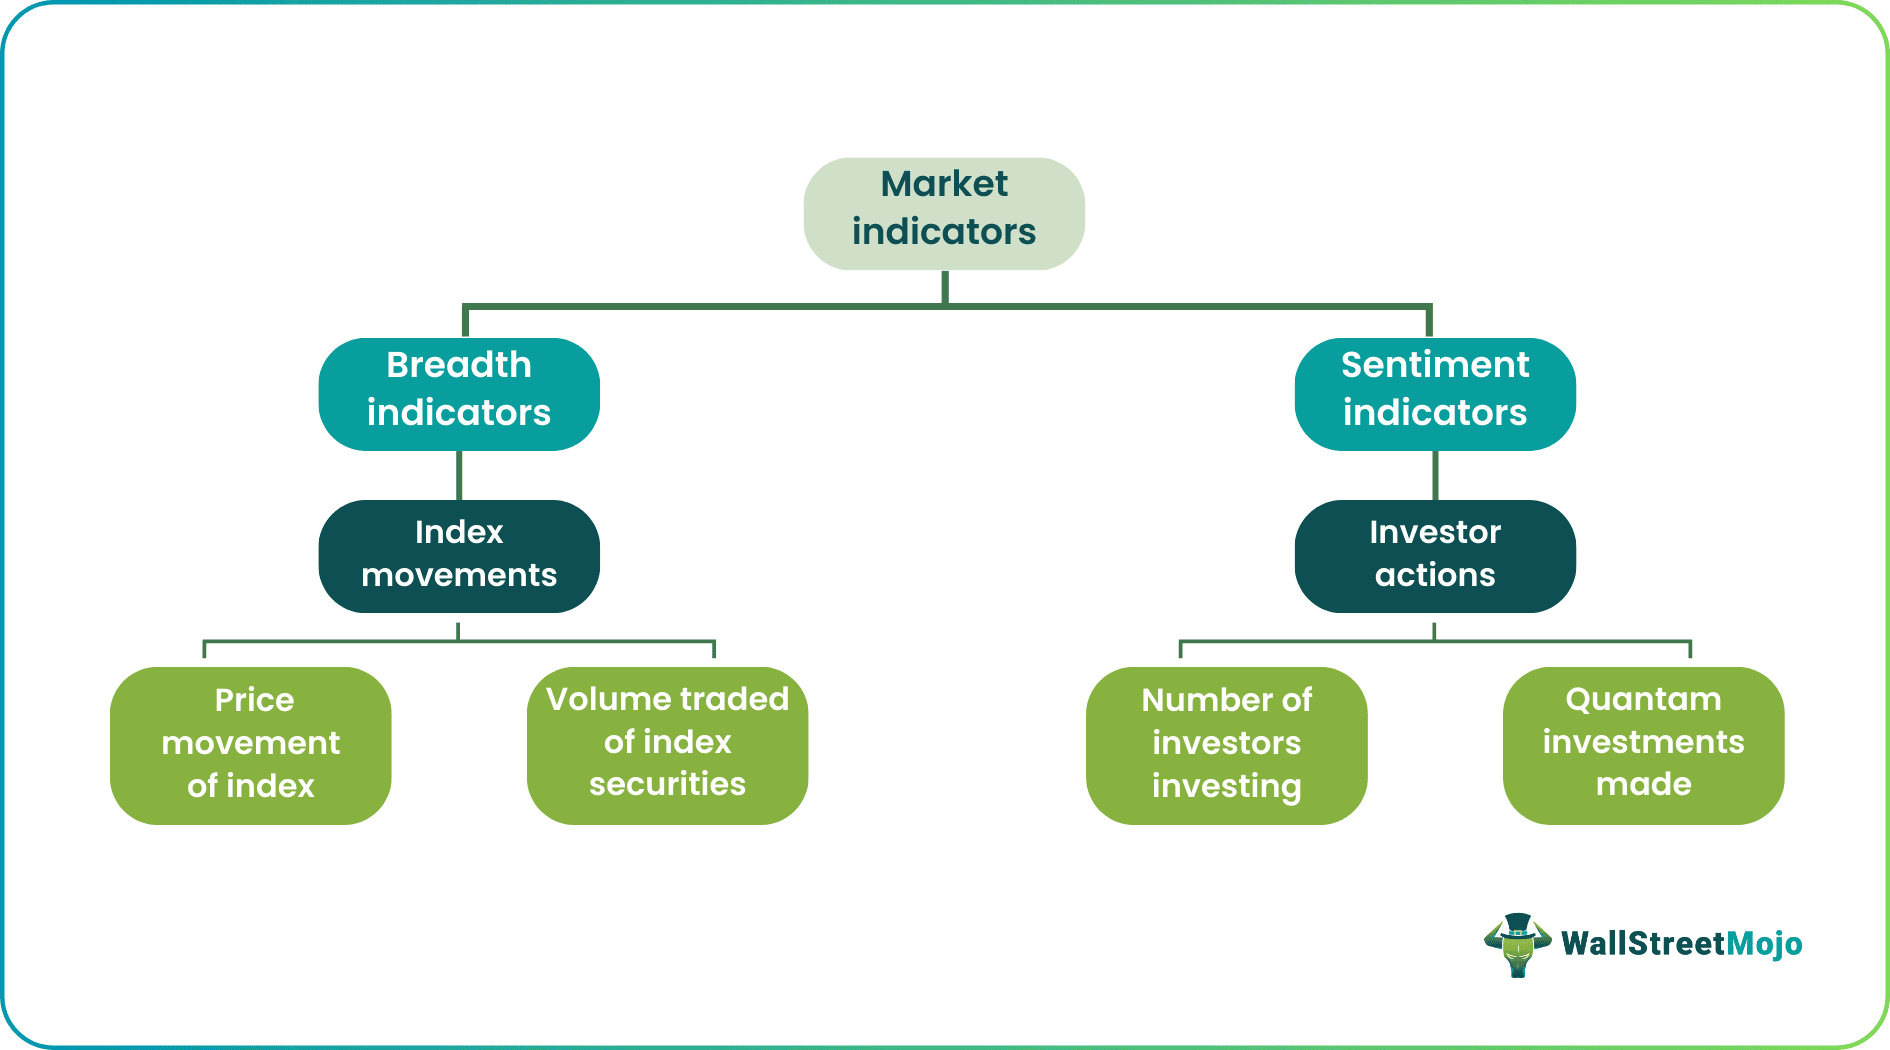
#1 – Market Breadth
These give the viewpoint of how the index or the market has moved during a given period being under analysis. These indicate how many securities within an index have seen an increase in price while how many have seen a decrease, or it can also be the case of how many have been bought and how many have been sold, and so on. It can be represented in a difference between the two numbers or a ratio.
#2 – Market Sentiment
These indicate how many investors are participating in a certain scenario in the market, such as buying the securities in an index or selling them. It can also be the case that what is the amount of investment investors are making in a certain index or market. It indicates how investors feel the market will move shortly or within a specified period.
Examples
Let us consider the following instances to understand the concept better and check how it is used in different scenarios:
Example #1 – Advance-Decline Line
One of the most common and popular market breadth indicators is the Advance-Decline (AD) line. For a select market or index, we look at the number of securities that faced an increase in price, i.e., those advanced, and the number of securities that faced a fall in price, i.e., those declined. The difference between the two is the Net advance, and it shows whether investors have been buying in the selected period or selling. If the Net advance is positive, the investors have been buying and vice versa. Investors buy when they feel that the stocks will go up in the future, i.e., they are bullish and vice versa.
Plotting the Net advances gives us the AD Line. AD Line is a cumulative number, i.e., the current period Net advance value is added to the previous period’s value to come up with the end of the period value.
There is one drawback to this indicator. For indices that face regular listing and delisting of securities, such as NASDAQ, the AD Line may not always be in sync with the index because the index removes the impact of the delisted stock while the AD line doesn’t.
AD Volume Line is similar to the AD line, but it analyses the Net advance in volume instead of price.
Example 2 – Put Call Ratio
It is a Sentiment indicator calculated by the Put volume to Call Volume ratio. Buying more Put options indicates that the investors feel that the prices of the securities are going to fall short, and the call option suggests the opposite.
So if the Put call ratio is greater, we can say that there is a bearish sentiment, and when it is less than 1, there is a bullish sentiment within the investor community.
At times, this indicator is even used in contrarian investing. When more and more put options are being bought, it may lead to an unrealistic fall in the underlying asset prices that overstates the risk associated with it. The opposite can be said about call options. Therefore the interpretation of sentiment indicators varies from one analyst to another.
How To Read?
Market indicators are of multiple types and they help assessing and analyzing various patterns and fluctuations. As a result, traders can use them to make wiser decisions. However, to interpret the indicators well, it is important to know how to read them.
There is a long laundry list of indicators, and new ones are fashioned by analysts every day. Therefore, analyzing all of them is not always possible.
The following are a few indicators of NYSE normally tracked by the investors:
- $NYUPV: It moves when the volume advances
- $NYUD: Advance-Decline Volume
- $NYADV: Issue advancing
- $NYAD: Advance-Decline Issues
- $NYMO: McClellan Oscillator (Ratio-Adjusted).
- $NYLOW: New 52-Week Lows
- $NYHGH: New 52-Week Lows
Following are a few indicators of NASDAQ normally tracked by the investors
- $NAAD: Same as $NYAD, only different.
- $NAMO: McClellan Oscillator (Ratio-Adjusted).
- $NAA150: Stocks Above 150-Day Moving Average
- $NAHLR: New High/Low Ratio
Many other exchanges such as AMEX, TSX, and TSX Ventures also have commonly tracked indicators. These indicators have varying data history and frequencies and may or may not reset daily.
By analyzing these indicators, investors predict how the market will react shortly and use such insights to make investing decisions.
Disclosure: This article contains affiliate links. If you sign up through these links, we may earn a small commission at no extra cost to you.
Recommended Articles
This article has been a guide to what are Market Indicators. Here, we explain the concept along with its examples, types, and how to read it. You can learn more about financing from the following articles –