Table Of Contents
What Is FOMC Dot Plot?
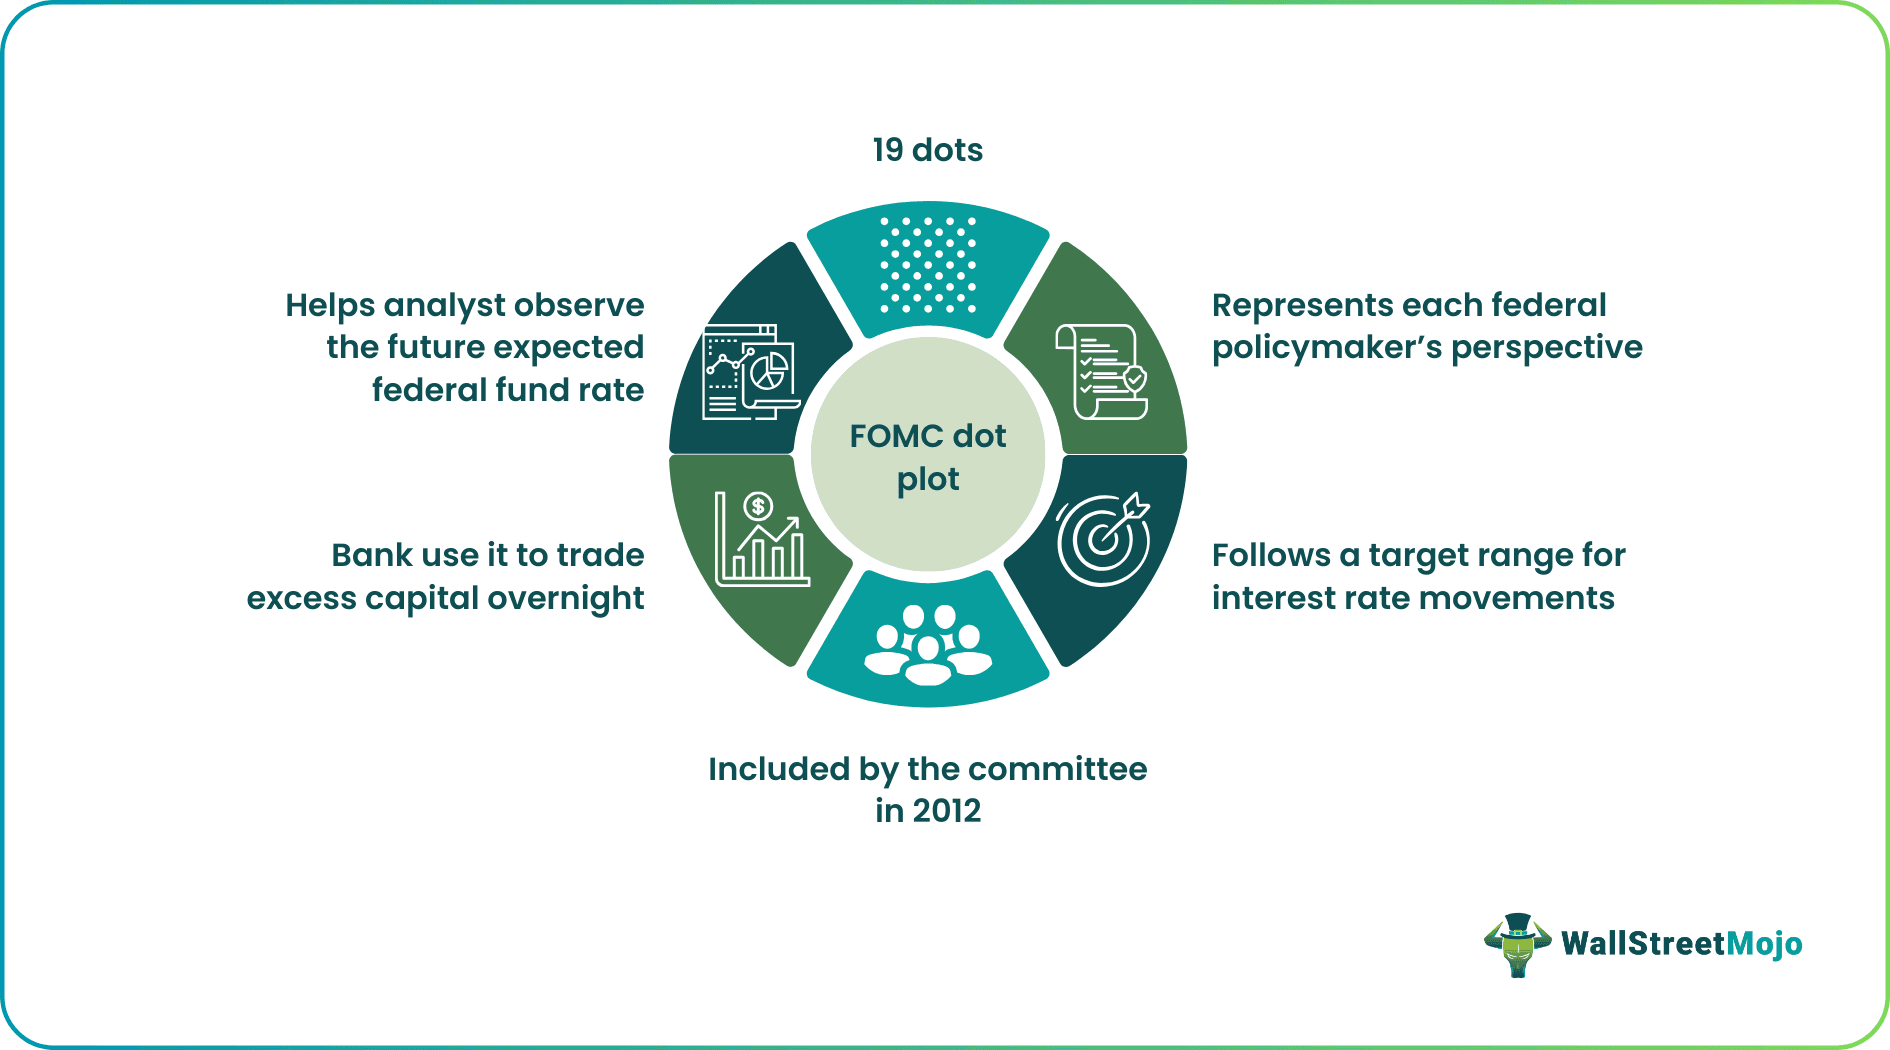
The Federal Open Market Committee or FOMC Dot Plot is a chart that presents a picture of how federal fund rates are expected to move in the immediate future. It projects anticipated changes in the central bank's key short-term interest rates and is published as the latest FOMC dot plot every quarter based on the available information.
Investors, economists, and market participants follow the chart closely to understand the anticipated future movement of federal fund interest rates. The chart is also called the Fed's dot plot. Federal officials developed the dot plot concept in 2012 when the US economy was recovering from the 2008 financial crisis, and interest rates had reached near zero.
Key Takeaways
- FOMC Dot Plot is a chart showing fluctuations in the federal fund interest rate commercial banks use to trade excess reserves overnight.
- The Federal Open Market Committee holds eight annual regular meetings at regular intervals of six weeks.
- The FOMC was created in 1935, but the dot plot was developed in 2012 to ensure transparency in monetary policies.
- It is not possible to identify which dot belongs to which member, so investors cannot assign importance or weightage to specific dots.
How Does FOMC Dot Plot Work?
The FOMC dot plot is the work of the Federal Open Market Committee. FOMC is a group of federal policymakers, and the dot plot is the chart that reflects their opinions on key short-term interest rates. Fed officials began the dot plot practice in 2012 when the economy was recovering from the 2008 financial crisis with the interest rates touching almost zero. However, the committee was formed through legislation made effective in 1933 and 1935.
The Federal funds rate is the interest rate that US commercial banks and other depository institutions apply while lending and borrowing funds from each other overnight. Each bank must maintain the required reserves to ensure its obligations are covered. When a bank has excess funds, they can lend it at a specific interest rate called the Federal funds rate.
As the Federal Reserve Bank plays a crucial role in maintaining stability in the US economy, the central bank wanted it to formally publish its opinion on interest rates, reassuring Fed watchers and helping them make individual decisions. They also sought opinions from Federal policymakers before finalizing policies because the Fed could guide investors well. The FOMC dot’s placement represents policymakers’ views about where the federal funds rate should be, i.e., any FOMC dot plot change is identified and estimated by the committee.
Federal policymakers rely on current data related to inflation, market trends, and other economic factors, incorporate them, and make the required changes and adjustments to their projections. In an economic, political, or global crisis, the dot plot no longer serves its intended purpose. Forecasts can change sharply based on economic shifts and major events. It also indicates investors value short-term interest rate fluctuations more while making financial decisions.
Many traders use Saxo Bank International to research and invest in stocks across different markets. Its features like SAXO Stocks offer access to a wide range of global equities for investors.
History
The FOMC was created by legislation passed by Congress in 1933 and 1935. Initially, the twelve Federal Reserve Banks functioned independently and collaboratively. In 1933, the FOMC was formed. This happened right after the Glass-Steagall Act, which defined how commercial banking was different from investment banking, earned recognition. However, the official FOMC administered today became effective in March 1936. It was brought into force by Section 12A of the Federal Reserve Act and amended by the Banking Act of 1935.
The Federal Open Market Committee comprises 12 members, seven of whom are the Federal Board of Governors and the president of the Federal Reserve Bank of New York. The remaining four seats are occupied on a rotation-based, one-year term by 11 Reserve Bank presidents from four regional groups. Each president is designated a seat in the committee. The regions are:
- Boston, Philadelphia, and Richmond
- San Francisco, Kansas City, and Minneapolis
- Dallas, St. Louis, and Atlanta
- Chicago and Cleveland
The appointed committee conducts eight meetings every year. Non-voting presidents attend meetings, share views and insights, and contribute to economic assessments. A key point is that while the committee only comprises 12 members at a time, the dot plot includes 19 opinions (dots on the chart) representing each Fed bank president. It is because their perspective is important for long-term predictions.
How To Interpret?
Earlier, the Federal Reserve Bank did not use the Fed funds target rate to frame interest rate policies. Analysts had to make assumptions about interest rate fluctuations without charts or tools.
Today, the FOMC dot plot chart represents a dot plot mapping the federal funds rate. It is a key short-term interest rate that affects consumer loans and savings interest rates. There are 19 dots, each representing the view of a federal policymaker about the target range for interest rates in a given year.
In the FOMC chart, the years are seen on the x-axis, and the y-axis indicates the future federal funds rate. Each dot defines a precise value and a range of federal rates. The chart also shows the median of the FOMC dots. The market is typically concerned about the median dot or projection.
Importance
Since the FOMC dot plot offers vital information about where the economy might be headed based on interest rate fluctuations, it has been assigned considerable importance. Some key reasons that highlight its importance are:
- The dots explain the views of federal policymakers regarding the future federal funds rate movement.
- As the chart helps predict the future rate ranges for the following year or two, it enables people with a high-yield savings account or a credit card debt to plan.
- It shows whether policymakers register concern about rising inflation and other prevailing market conditions. Their views help people make decisions.
- The FOMC dot plot outlines clusters, allowing investors to see the Fed’s bias (if any).
- It was introduced because the central bank wanted investors and federal watchers to understand official views about interest rate movements. They endeavored to make the right policy decisions keeping these observations in view.
Disclosure: This article contains affiliate links. If you sign up through these links, we may earn a small commission at no extra cost to you.

Frequently Asked Questions (FAQs)
The FOMC chart is updated quarterly, which means four times a year. The federal funds rate is set by the members of the FOMC. Commercial banks apply this rate while borrowing and lending excess reserves overnight. The FOMC members set the target federal funds rate eight times a year.
The US Federal Reserve updates the target range of the FOMC dot plot. The range has an upper and lower limit. Therefore, it changes with time. Reaching 5.1%, it peaked in 2023, the highest since August 2007.
Nineteen dots are seen on the FOMC dot plot. Each dot represents a federal policymaker, further divided into governors and presidents of Federal Reserve and commercial banks, respectively. There may not be 19 dots if there are vacancies in the Federal Reserve System. In March 2019, there were only 17 dots.
