
Table Of Contents
What is Moving Average?
Moving Average (MA), commonly used in capital markets, can be defined as a succession of mean derived from a successive period of numbers or values. One would calculate the same continually as the new data is available. It can be a lagging or trend-following indicator, as this would be on previous numbers.
Traders and investors use a moving average trading strategy to understand the direction of trends in the market. They can choose a particular period in the market, add up all data points and divide the total by the number of time periods within the chosen time frame. In addition, traders observe volume analysis and trendlines to better understand the trends.
Key Takeaways
- Moving Average (MA) is a widely used tool in capital markets. It involves calculating a series of means from consecutive periods of numbers or values.
- MA can be continuously updated as new data becomes available, making it useful for tracking trends. It can be a lagging indicator, reflecting past data points.
- MA is a type of arithmetic average that specifically considers closing numbers, such as stock prices or account balances.
- Moving averages are commonly employed in technical analysis to analyze stock prices and identify hidden trends. Analysts use MA to gain insights into market movements and make informed decisions.
Moving Average Explained
Moving average is a type of arithmetic average. The only difference here is that it uses only closing numbers, whether stock prices or balances of accounts etc. So, the first step is to gather the data of the closing numbers and then divide that number by the period in question, which could be from day 1 to day 30, etc. After that, another calculation is an exponential moving average indicator.
Players in the market, especially intraday traders observe charts and indicators such as moving average line, moving average convergence divergence (MACD) in combination with relative strength index, and on-balance-volume to gain a better understanding of the stock’s potential movement in the market.
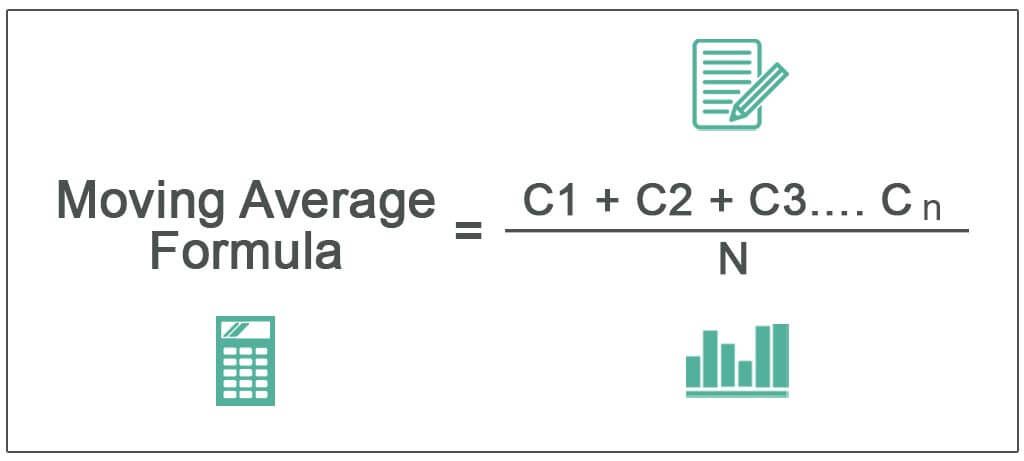
Formula
Where,
- C1, C2…. Cn stands for the closing numbers, prices, or balances.
- N is the number of periods for which the average requires to be calculated.
Examples
Let us understand how the concept of moving average indicator and its other implications work with the help of a couple of examples.
Example #1
Stock X traded at 150, 155, 142, 133, and 162 for the previous five trading days. Therefore, you must calculate the moving average based on the given numbers.
Solution
Use the following data for calculation:
| Stock Closing Prices | |
| Day 1 | 150 |
| Day 2 | 155 |
| Day 3 | 142 |
| Day 4 | 133 |
| Day 5 | 162 |
One can calculate MA using the above formula:

- (150+155+142+133+162)/5
The moving average for the trending five days will be:

- = 148.40
The MA for the five days for the stock X is 148.40
Now, to calculate the MA for the 6th day, we need to exclude 150 and include 159.

Therefore, Moving Average = ( 155 + 142 + 133 + 162 + 159 ) / 5 = 150.20 and we can continue doing this.
Example #2
Alpha Inc. was incorporated as a bank last year. Now it is almost year-end to report the financial statement of the firm. The norms of the Central Bank asked the banks to report the average balances of the account instead of closing balances at the end of the year. One should do the average balances monthly. The financial analyst of the firm took sample account #187, where below were the closing balances reported.

It would be best if you calculated a simple moving average based on the above closing balances.
Solution
First, in this, we will calculate the sum of the closing balances to calculate the average.
The cumulative total for day 10 will be:

- Cumulative Total for Day 10 = 124102856.26
The cumulative total for day 11 will be:

- Cumulative Total for Day 11 = 124739450.26
Similarly, we can calculate the cumulative total for the remaining days.

Therefore, the simple MA for 1st 10 days will be as follows,

=124102856.26/10
The MA for 1st 10 days will be –

- The MA for 1st 10 days = 12410285.63
Therefore, the simple MA for the 11th day will be as follows:

- MA for 11th Day = 12473945.03
Similarly, we can calculate the moving average for the remaining days'.

Example #3
Mr. Vivek wants to compute the estimated price of the onion for tomorrow based on an average of the last ten days. He believes there is a 10% upwards trend because of rising fuel prices. Also, he believes that the prices of onions fluctuate based on moving averages. The last ten days’ prices of the onion per kg are 15, 17, 22, 25, 21, 23, 25, 22, 20, and 22. Based on the criteria, you must compute the projected onion price on day 11.
Solution
Use the following data for the calculation of moving an average in Excel.
| Day | Prices |
|---|---|
| Day 1 | 15 |
| Day 2 | 17 |
| Day 3 | 22 |
| Day 4 | 25 |
| Day 5 | 21 |
| Day 6 | 23 |
| Day 7 | 25 |
| Day 8 | 22 |
| Day 9 | 20 |
| Day 10 | 22 |
| Day 11 | 21 |
| Day 12 | 20 |
| Day 13 | 17 |
| Day 14 | 19 |
Therefore, 7 days of MA in Excel will be as follows:

- 7 Days MA = 21.14
Therefore, the next 7 days of MA will be as follows:

- = 22.14
Similarly, we can calculate 7 days MA as shown below.

Estimated Price on Day 15

The 7-day MA for the onion price is 20.14.
There will be a fuel price increase, which could inflate onion prices.
Therefore, the projected onion price on day 15 will be 20.14 * 1.10 = 22.16, which can be rounded off to 22.
Types
Since it is not a one-size-fits-all phenomenon, different players in the market use different versions of it for different purposes. Some use moving average trading strategy, some just want to understand the trend of the market, and a few analysts use to carry out a detailed analysis. Let us understand the different types through the discussion below.
- Arithmetic Method: This is the simplest method of calculating and using the moving average indicator. It is calculated by adding all data points in a period and dividing it by the number of time frames.
- Exponential Method: The arithmetic method sometimes is not accurate with stocks that have moved significantly in the market in a short span of time. Therefore, traders and analysts use the exponential method which gives great impetus to the recent periods.
- Weighted Method: Under this method, each period’s movement in averages is given importance or a specific weightage while calculating the average.
- Triangular Method: The Triangular Moving Average or TMA calculates the average twice by calculating the simple or arithmetic average first. This is a sub-type of the weighted method where the weightage to time frames is given on a triangular pattern.
- Variable Method: Variable Moving Average or VMA was developed and proposed by Tushar Chande in 1991. It was developed with the belief that using a volatility index would make adjustments to the smoothening period where the market conditions experienced changes.
Uses
The moving average indicator is most commonly used in capital markets for analyzing stock prices while conducting technical analysis. By using the moving average, the analyst tries to uncover if there are any trends hidden in it. However, these are usually used as lagged indicators based on previous numbers. Hence, these averages can never be greater than the closing prices. Further, it is also used in computing support and resistance levels in technical charts.
