


What Is the Presidential Cycle?
Presidential cycle theory defines the U.S. stock market behaving a certain way every time a new U.S. president is elected. The equity market returns follow a predictable fixed path, and the change is observed every year of the four-year presidential term.
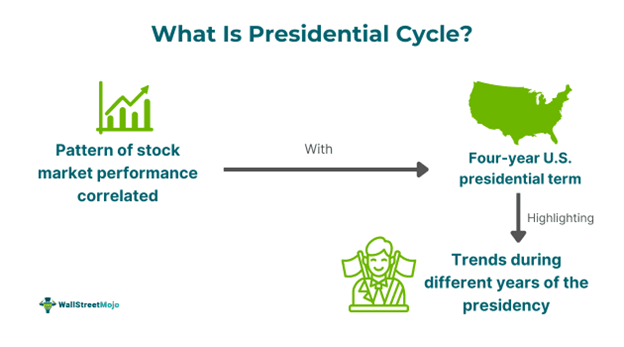
The equity market declines to the weakest in the first year, then starts recovering in the second year, reaching its peak by the third year and falling again for the fourth and final year. This pattern has been observed historically, and the same cycle will again begin for the next presidential election.
Key Takeaways
- The presidential cycle represents the predictive behavior of the U.S. equity market over the four-year presidential term.
- The third year of the term is often considered the best time for the market, as historically, the S&P 500 has shown the most robust performance during this year.
- If a new party comes into power, there is a higher possibility that the market will decline during the first year of the presidential term due to policy changes and uncertainties.
- In a presidential cycle, sectors such as healthcare, energy, and other public sectors are often closely monitored for potential good returns, especially as new policies and regulations come into play.
Presidential Cycle Explained
The presidential cycle theory defines the effect of U.S. presidential elections on the stock market and other capital markets. Analysts have observed a pattern suggesting that the equity market performs in distinct ways during each year of the four-year presidential term.
The stock market presidential cycle is influenced by changes in the political climate, new policies, laws, and regulations introduced in the U.S. While no theory or phenomenon can accurately time the market or offer 100% accuracy, the presidential cycle is supported by decades of market research and analysis. For general investors, these stock market changes can significantly impact their portfolios, both positively and negatively, depending on the sectors and industries they have invested in over the years.
The general pattern observed is:
- Post-Election Year (Year 1): The equity market often slightly declines and remains subdued for over a year, while bonds may outperform. This is due to uncertainty and the administration’s implementation of new policies.
- Midterm Year (Year 2): The market starts to recover as the new policies are absorbed and economic conditions stabilize.
- Pre-Election Year (Year 3): This year typically sees the most robust market performance, as the incumbent administration often implements measures to stimulate the economy.
- Election Year (Year 4): Market performance can be mixed due to election uncertainties and potential changes in policy direction.
Historically, when a new party comes to power, the stock market’s average gains are around 5%, while if the incumbent president is re-elected, returns average around 6.5%. Investors following the presidential cycle theory are often advised to restructure their portfolios accordingly and monitor sectors explicitly impacted by the election and new government policies.
History
The history of the presidential cycle theory dates back to the early 1930s, suggesting a recurring pattern over the past nine decades. Analysts report that compared to other periods, both equity and bond markets often showcase static or uncertain behavior in the year leading up to a presidential election.
Historically, equities have offered average gains of about 8.5% in any 12 months. However, in the year leading to elections, gains often decrease due to political uncertainty. In contrast, bond market returns can vary, but they generally offer stable returns during election years.
Since 1928, the third year of the presidential cycle has provided positive S&P 500 returns approximately 78% of the time, with an average return of about 13.5%, compared to an average of 7.7% in other years. This pattern is recognized even in U.S. politics, which often experiences midterm election setbacks. Major financial crises are among the few events that have significantly disrupted these patterns, affecting both bond and equity markets.
Assumptions
The Presidential Cycle Theory operates on several critical assumptions regarding the behavior of the stock market throughout a president’s four-year term:
- Weakness in the first two years: The theory assumes that the market is weakest in the first two years due to factors such as wars, recessions, and external and internal economic shocks.
- Recovery in the third year: According to the theory, the market starts recovering in the third year. This is based on the assumption that most presidents, in preparation for reelection, take actions to boost the economy during this period.
- Predictive limitations: While the theory does not predict or time the stock market with 100% accuracy, historical data supports the existence of this pattern.
Examples
Let’s understand the concept using hypothetical and real-world examples.
Example #1
Suppose Oliver has just started a new job and has decided to invest in the stock market. Since it is his first time, he does a lot of research and feels equally nervous. Oliver comes across the theory of the presidential cycle, and after looking at historical patterns, he is convinced that he should follow it.
Oliver knows it has already been a year since the current president was elected in the U.S. According to the presidential cycle, this makes him think he should wait for another six months before investing in stocks, as the market typically starts recovering from the second year. Oliver waits for the next six months, saving his income to invest a lump sum when the market conditions are favorable.
At the same time, based on the cycle, the market is expected to decline in the fourth year. Therefore, Oliver decides to exit the market with reasonable returns within the first quarter of the fourth year. This strategy will help him achieve short-term returns.
Example #2
A real-world stock market presidential cycle example suggests that the third year has historically been the best for the stock market. Based on historical data since 1945, the S&P 500 has averaged a 15.9% gain in the third year before the election, compared to an overall average of 9.2% per year.
According to data from CFRA Research, in the first quarter of the third year, the S&P 500 averaged a 6.9% gain, which is more than three times higher than the 2.1% average gain for the first quarter of every year. In the third year of Donald Trump’s presidency in 2019, the S&P 500 surged nearly 29%.
Frequently Asked Questions (FAQs)
Frequently Asked Questions
What is the 4-year stock market presidential cycle?
The 4-year stock market presidential cycle suggests a predictable pattern in stock market behavior aligned with the U.S. presidential term. Typically, the market declines in the first year, begins to recover in the second year, peaks in the third year, and then falls again in the fourth year. This pattern is attributed to the political and economic actions taken throughout the term.
Who introduced the presidential cycle theory?
Yale Hirsch, a stock market historian, proposed the theory. He created the stock trader’s almanac and founded the Hirsch Foundation, through which he published numerous newsletters. Hirsch is widely quoted in stock market journals, magazines, and research papers.
What is the difference between the presidential cycle and the economic cycle?
The presidential cycle represents the change in the stock market that occurs due to the presidential election in the U.S. that changes each year for the four-year term. In contrast, the economic cycle showcases the overall state of a nation’s economy through four phases: expansion, peak, contraction, and trough.