Table Of Contents
Price To Sales (P/S) Ratio Meaning
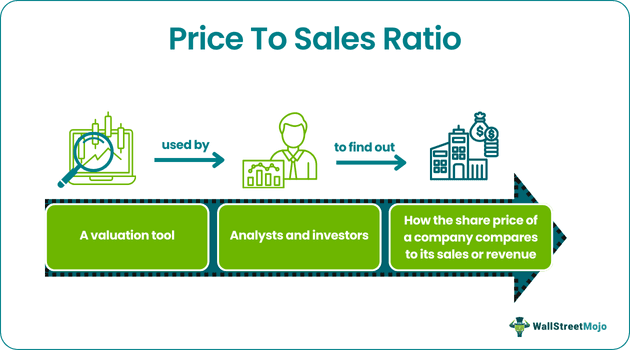
The price to sales ratio or P/S ratio indicates how much an investor must pay to purchase one equity share of a company compared to the revenue generated per share. One can use this ratio to determine if a stock is undervalued or overvalued.

The metric can offer insight into a company's health by comparing it against its industry peers. However, it is based on revenue only, not cash flow or profits. Hence, comparing the valuations of companies recording negative cash flow or little or no profit is extremely useful. Typically, the lower the P/S ratio, the better.
Key Takeaways
- The price to sales ratio definition refers to a valuation tool that investors can use to compare the market value of a company's equity share to its sale.
- It is especially useful to value a growth stock that suffered a temporary setback or is yet to report a profit.
- A price-to-sales ratio analysis tells whether investors pay less or more for each dollar of sales or revenue.
- One can calculate the price-to-sales ratio by dividing a company's market value per share by the sales per share.
- The P/E ratio is more volatile than the P/S ratio.
Price To Sales Ratio Explained
Price to sales ratio definition refers to the valuation ratio indicating how much an investor is willing to shell out per dollar of revenue or sales for a stock. It offers valuation based on a company's operations without considering any accounting adjustment. Moreover, this ratio helps new companies without any net earnings place a valuation on their assets.
A low price-to-sales ratio analysis might imply an undervalued stock. In contrast, a high ratio may indicate an overvalued stock. That said, one must also look at this valuation ratio from an industry and historical standpoint.
Generally, in this case, the 12-month duration for revenue is the last four quarters or the trailing 12 months (TTM) or the current fiscal year. When this ratio is based on a company's predicated revenue or sales for the current fiscal year, it is the forward P/S ratio.
The standard range for this ratio varies from one industry to another. Hence, benchmarking this metric should be done among comparable or similar companies.
The P/S ratio does not consider debt, unlike the enterprise value to sales or EV/sales ratio. Moreover, the latter does not utilize market capitalization like the former. Instead, it uses enterprise value, which adds preferred shares and debt to market capitalization and deducts cash.
Formula
One can use the following formula to calculate the price to sales ratio:
Price To Sales Ratio = Price Per Share/ Sales Per Share
Revenue vs Sales Explained in Video
Calculation Example
Let us look at this price-to-sales calculation example to understand the concept better.
The table below shows the price per share and sales per share of GripMaster, a tire manufacturing company.
| Name | 1st Year | 2nd Year | 3rd Year | |
|---|---|---|---|---|
| Price Per Share | P | 8 | 10 | 12 |
| Sales Per Share | S | 6 | 7 | 8 |
| P/S Ratio | P/S | 1.33 | 1.43 | 1.50 |
As one can observe from the table, the P/S ratio in the first year was 1.33 (8/6). Over the next two years, GripMaster's share price surged by 50%. That said, the company's sales per share increased slower during the same period. This means that investors paid more in the 3rd year than two years back.
If individuals look at the valuation ratio in the first year, they can observe that investors were paying $1.33 for every share. In the 3rd year, they were shelling out $1.50 for each company share. Of course, the increase in the P/S ratio could be due to various factors, for example, investor speculation, market trend, etc.
Advantages And Disadvantages
Let us look at the benefits and limitations of the P/S ratio.
Advantages
- It can be useful even if a company reports a net loss.
- This ratio is less volatile than the P/E ratio.
- It is a suitable measure for startups, unlike P/E, as the latter can be misleading.
- This ratio is a useful valuation tool for mature or cyclical industries.
Disadvantages
- Sales per share do not offer a clear picture to investors and analysts as it does not consider the impact of a company's capital and cost structure.
- The P/S ratio is not entirely immune from manipulation.
- This ratio cannot catch the cost structure differences across companies.
- It does not consider whether a company is generating any income or will ever report any revenue.
Price To Sales Ratio vs Price To Earnings Ratio
Price To Sales Ratio
- This ratio is based on sales.
- It indicates how much investors are paying per dollar of sales.
- One can use it to analyze loss-making companies.
- This ratio is less volatile.
Price To Earnings Ratio
- The basis for the P/E ratio is earnings.
- The P/E ratio indicates how much investors pay for each dollar of earnings.
- Typically, investors use this metric to analyze mature or profitable companies.
- It is more volatile.

