What is PE Ratio?
PE ratio determines the price an investor pays for a stock to earn one dollar from it. PE denotes the price to earnings ratio. The ratio determines how a company is faring in comparison to the competition and its past performance.
The price-to-earnings ratio can be a trailing PE multiple. For this, the earnings of the previous twelve months are computed. Alternatively, it can be a forward price-to-earnings ratio. Forward PE is calculated by dividing the prospective earnings in the upcoming months by the price per stock.
Key Takeaways
- The price-to-earnings ratio is the proportionate value of a share’s market price and earnings. It shows the number of times the earnings need to be invested in a stock.
- Calculation: PE Ratio = Price Per Share/ Earnings Per Share.
- The trailing price-to-earnings ratio is based on past earnings, while the forward price-to-earnings ratio depends on the forecast of future earnings.
- The analysts correlate a company’s PE multiple with the PE multiples of competition within the industry. This way, the appropriate valuation of a share is ascertained.
PE Ratio Explained
The price-to-earnings ratio is a measure that reflects an organization’s potential to make money. This potential is measured in terms of the value paid by equity holders for each stock unit. Thus, it indicates if a particular stock is cheaper or costlier than its competitors within the same industry. Additionally, the current price-to-earnings ratio can be compared to the company’s past ratios to track its growth. The price-to-earnings ratio can be of two different forms trailing price-to-earnings multiple and the forward price-to-earnings ratio.
This is the most common equity multiple. An equity multiple is a metric that calculates the expected or achieved total return on an initial investment. The price-to-earnings ratio is widely used for measuring equity because of data availability. This is especially the case with historical earnings and forecasted earnings.
In addition, the Price-to-earnings ratio has an advantage of discounted cash flow valuation (DCF) technique; it is not sensitive to assumptions. In DCF, changes in WACC or growth rate assumptions can dramatically change the valuations. Therefore price-to-earnings ratio is extensively used for comparing companies within a sector.
Also, the effort required for this valuation method is relatively less. In contrast, a typical DCF model may take 10-15 days of the analyst’s time. For the same valuation, a comparable PE comp can be prepared within hours.
PE Ratio Explained in Video

PE Ratio Formula
The price-to-earnings ratio is primarily derived from the payback multiple. The Payback multiple is the time required to recover initial costs and expenses.
Similarly, the PE ratio is the number of yearly share earnings it will take an investor to recover the price paid for the share.
For instance, if the PE multiple is 10x. It implies that for each $1 of earning, the investor has paid $10. Hence, it will take ten years of earnings for the investor to recover the price paid.
It is computed as:
PE Ratio Calculation
The calculation of price to earnings ratio of any company involves the following three steps:
- Finding the market price of each share of the company: This information can be availed from NASDAQ and other stock exchange where the company is listed. This value fluctuates constantly.
- Locating or evaluating the per-share earnings of the company: The organization’s profit or revenues, whether historical or forecast, can be found on the websites like Bloomberg, Reuters, Yahoo Finance, etc. Alternatively, PE ratio can be calculated by dividing the company’s net profit (profit after tax) by the number of outstanding common stocks.
- Applying the PE formula and calculating the PE ratio: Lastly, divide the price per stock (as in step 1) by the earnings per share (determined in step 2) to get the PE multiple.
Further, after getting the PE value of a firm, the analyst can compare it with other organizations and past PE multiples.
For example, as of December 31, 2020, the stock price of XYZ Inc. was $197.42. The company has earnings per share of $1.39 in 2020. Now, figure out its price-to-earnings for 2020. Let us assume there is another company ABC Ltd. whose PE ratio is 211.17. Now, find out which investment opportunity of the two is more beneficial.
Given:
- Price per share = $197.42
- Earnings per share = $1.39
- PE Ratio = Price Per Share/ Earnings Per Share
- PE Ratio = 197.42/ 1.39
- PE Ratio = 142.03
This means an investment of $142.03 in XYZ Inc. will yield $1. The price-to-earnings of ABC Ltd. is 211.17, while that of XYZ Inc. is 142.03. This indicates that if investors invest in XYZ Inc, they can generate the same earnings by investing 69.14 times less. Clearly, XYZ Inc. is a better option.
PE Ratio Examples
#1 – Price to earnings ratio of Colgate compared to the industry
Now let us take a real-world example to compare the PE Ratio of one company with the other companies of the sector.
Let us look at the PE multiple of Colgate and its comparison with the industry.
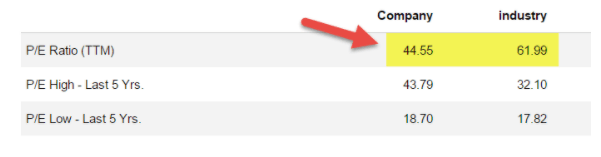
Here, Colgate’s price-to-earnings ratio is 44.55x; however, the Industry’s Price Earnings Ratio is 61.99x. Clearly, Colgate is outperforming. So naturally, investors would prefer paying $44 to earn 1$ instead of paying $62 to earn the same.
#2 – PE Ratio of Tesla Inc.
Tesla Inc. has a price-to-earnings multiple of 407.05 at present, while its forward price-to-earnings ratio for 2022 is 223.41.
How to Find Target Price using Price to Earnings Ratio?
Target Price is what we expect the stock price to be, say at the end of 2016 or 2017.
Let us look at another PE Ratio Example.
Let us assume that WallStreetMojo is operating in Services Sector along with its peers – AAA, BBB, CCC, DDD, EEE, FFF, GGG, HHH.

In order to find the Target Price of WallStreetMojo, we need Average Trailing PE values and Forward PE values. The Average Trailing PE Ratio is 56.5x, and the Forward PE Ratios are 47.9x and 43.2x, respectively.
WallStreetMojo’s Target Price = EPS (WallStreetMojo) x Forward PE Ratio
Let us assume that WallStreetMojo 2016E and 2017E EPS are $4 and $5, respectively.
Based on the PE multiple formulae above,
- WallStreetMojo 2016E Target price = $4 x 47.9 = $191.6
- WallStreetMojo 2016E Target price = $5 x 43.2 = $216
Theoretically, the Target Prices look good. But, practically speaking, the Target Prices look all wrong. Why is that so?
Target prices look all wrong due to the presence of outliers in the Comparable Table prepared. Please note that HHH has a Price Earnings Ratio closer to 200x. There could be various reasons for the high Price Earnings Ratio of HHH; however, we are here to find the appropriate target price for WallStreetMojo.
For finding the Correct Target Price, we need to remove outliers like HHH, revise the Comparable Table, and find the new average PE multiple. Then, using these modified PE Ratios, we can re-calculate the Target Price.
Target Price PE Example
- Revised WallStreetMojo 2016E Target price = $4 x 17.2 = $68.8
- Revised WallStreetMojo 2016E Target price = $5 x 18.2 = $91
Limitations
Price to earnings ratio is a method of identifying a firm’s progress. However, it seems unsuitable at times for the following reasons:
- Ignores Balance Sheet Risk: Since the price-to-earnings ratio fails to account for balance sheet risk, the fundamental position of the company is not reflected correctly. Balance sheet risks are determined by cash ratios, current ratios, and quick ratios.
- Doesn’t Account Cash Flows: It also fails to represent cash flows from operations, investments, and financing.
- Indirectly Affected by Debt-to-Equity Ratio: Different debt to equity structures can significantly affect a company’s earnings. Earnings can vary widely. When a company is in debt, interest payments affect earnings per share.
- Not Applicable for Negative Earnings: Price to earnings ratio doesn’t work for unprofitable companies like Box Inc. One must use normalized earnings or forward multiples in such cases.
- Companies can Manipulate Earnings: Earnings are subject to different accounting policies. The management can easily manipulate or mislead.
Frequently Asked Questions (FAQs)
What is a good PE ratio?
A good price-to-earnings ratio is the one that is lower than the price-to-earnings multiple of competing firms, the whole industry, or the previous ratios of itself. In other words, the PE multiple is the number of times one pays for yielding a dollar. The stock is more affordable to an investor if the number is lower.
What is the PE ratio of the S&P 500?
As of October 04, 2021, the trailing-twelve-month price to earnings ratio of the S&P 500 is 33.54. This value is based on its current market price and recent earnings.
How do you know if a stock is overvalued?
The price to earnings ratio of any company gauges its market valuation. A stock with a higher PE multiple signals its overvaluation. However, considering other factors like debt, business model, and industry’s performance can help discover the reasons behind the PE figures.
Recommended Articles
This has been a guide to what PE Ratio is and its meaning. Here we explain how to calculate the price to earnings ratio along with its formula, examples and limitations. You can learn more about from the following articles –