


What Is Vortex Indicator?
A vortex indicator is a stock market technical indicator and analytical tool that uses historical price data and varying patterns to identify and predict the market’s new and prevailing price trends. The indicator identifies both positive and negative price trends.
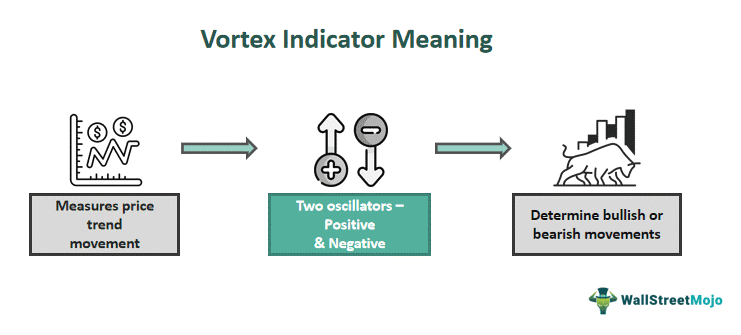
The indicator’s application is not limited to currencies, commodities, and other capital market stocks. It consists of two indicator lines, positive and negative, that predict the upward and downward market trends. Line formation forms a vortex-like shape and hence is named a vortex indicator.
Key Takeaways
- Vortex is a technical indicator that uses historical price data to identify new and existing price patterns.
- It is applicable in different financial markets and consists of two indicator lines for positive and negative trends, respectively.
- This indicator will always be either above or below a key level, indicating a clear bullish or bearish bias.
- Its calculation is complex and requires practice and close monitoring to understand and interpret correct results.
Vortex Indicator Explained
The vortex indicator is an analytical indicator developed by Etienne Botes and Douglas Siepman, inspired by the works of Welles Wilder and Viktor Schauberger, who are considered the fathers of implosion technology. Both individuals were astonished by the vortexes created in water and hence borrowed the concept and applied it to financial markets. The indicator uses historical data and price patterns to derive trade (buy and sell) signals for traders and analysts. Whether it is a forex vortex indicator or a chart from the commodities market, it is easy to interpret, though the calculation is complex.
The vortex indicator strategy is often used with other technical indicators to ensure accuracy and reliability in investing decisions. It offers clear signals and an overall trend. The trader can choose to apply it for different periods, from weekly to monthly charts, depending on the vision of the trader. Many traders simultaneously use this indicator for intraday trading, and some use them to spot long-term investing opportunities.
Theoretically, this indicator sounds simple but has a complex setting and is not used frequently by retail investors. The oscillators take account of the previous two days’ highs and lows. At the same time, the length of the lines represents the trend strength.
How To Use?
- This indicator has two indicator lines, also called oscillators, one positive and the other negative.
- The lines follow a crucial level and move around and across it.
- When the (+) oscillator moves or crosses above the (-) trend line, it means a bullish signal.
- Likewise, when the (-) trend line crosses the (+) oscillator line, it means a bearish market signal.
- It is used to identify a trend’s start and can also confirm its direction. A simple cross can be applied at the beginning of the trend, and another cross above or below the critical level affirms the direction.
- The forex vortex indicator calculation consists of three parts. Based on highs and lows, the trend movement is determined. It can be either positive or negative.
- Secondly, the actual range is derived from measuring the volatility.
- Thirdly, the trend movement is divided by the actual range to normalize the price trend movement.
- The volatility-adjusted oscillation is attained, with two indicators oscillating above or below 1.
- A trader can apply it to identify short-term or long-term investment opportunities.
Examples
Let us look at some examples to understand the concept better:
Example #1
Suppose a chart with two indicator lines, positive and negative, for 18 days.
First, calculate the upward and downward movements with the number of periods.
Upward movement (VM+) = current high – previous low.
Downward movement (VM-) = current low – previous high.
Now, calculate the number of periods.
Since it is for 18-day periods, then
VM20(+) = 18 period sum of VM(+)
VM20(-) = 18 period sum of VM(-)
Calculating the true range:
The true range is the maximum of either of the following:
- Current high – current low
- Current low – previous close
- Current high – previous close
Calculating for the specified period:
For 18 periods = 18 – period, the sum of the true range
Calculate VI+ and VI-
VI18(+) = VM18+ / TR18
VI18(-) = VM18- / TR18
Example #2
The VIX index developed to gauge the market’s expected volatility came under pressure, coinciding with solid performances across stocks, crypto, and commodities. The index went 22.3% downward and traded at $27.26. Thus, the spread shares the same indication as it widens. The 25-period to 50-period moving average made a bearish crossover; therefore, it was well-sighted in this indicator.
The index is on the Chicago Board Options Exchange and was developed by CBOE and Goldman Sachs. It uses option market data to rise when investors are fearful about the market generally.
Vortex Indicator vs ADX
The primary differences between the two concepts are as follows:
| Vortex Indicator | Average Directional Index (Adx) |
|---|---|
| It uses price and volume to determine the trend’s strength. | ADX uses the difference between two moving averages. |
| It helps in identifying early trend changes. | ADX can tell whether a trend is likely to continue or will reverse. |
| This indicator was developed in 2009. | ADX was created in 1978. |
| By plotting this indicator lines on a chart, a trader can spot the point from where the trend starts to decline in momentum. | If the value of ADX is above 25, it indicates a strong trend, and vice versa. |
Frequently Asked Questions (FAQs)
Frequently Asked Questions
What is the vortex indicator formula?
The vortex indicator formula has three significant steps to follow: calculating the trend movement, which can be positive or negative. To gauge volatility, the true range is determined, and the trend movement is divided with the true range to smooth the movement.
Is the vortex indicator accurate?
The vortex indicator strategy accurately predicts good buy and sell signals in multiple financial markets. At the same time, it accurately spots trend reversals in the market based on historical data and supports both short-term trading and long-term investing.
What is the vortex indicator tradingview?
Tradingview is an online platform to view and study stock charts, candlesticks, and other technical indicators analysis. Any trader willing to understand has an in-depth look at stock performances. It is an excellent way to watch and observe the indicators of different assets.