What is Adjusted R Squared?
Adjusted R Squared refers to the statistical tool that helps investors measure the extent of the variable’s variance, which is dependent and explained with the independent variable. It considers the impact of only those independent variables that impact the variation of the dependent variable. It is also observed that an adjusted R squared value does not compare different variables with the index like its counterpart.
Adjusted R Squared or Modified R^2 determines the extent of the variance of the dependent variable, which the independent variable can explain. The specialty of the modified R^2 is that it does not consider the impact of all independent variables but only those which impact the variation of the dependent variable. Therefore, the value of the modified R^2 can also be negative, though it is not always negative.
Adjusted R Squared Explained
Adjusted R Square is a significant output to determine whether the data set is a good fit. Someone does a regression equation to validate whether what he thinks of the relationship between two variables is also validated by the regression equation. The higher the value, the better the regression equation, which implies that the independent variable chosen to determine the dependent variable is chosen appropriately. Ideally, a researcher will look for the coefficient of determination closest to 100%.
Usually, the adjusted R squared curve is positive and is always lower than the R squared value. It is vital to note that the adjusted R squared calculator is used to calculate the correlation’s reliability. To test the same, an additional variable is added to the equation to check for changes in the correlation.
In a portfolio model with multiple independent variables, this calculation will help the investor establish how much of the correlation with the index is because of the addition of those extra variables. It nullifies the effect of the additional variables unless it adds to the correlation between the index and the primary variables.
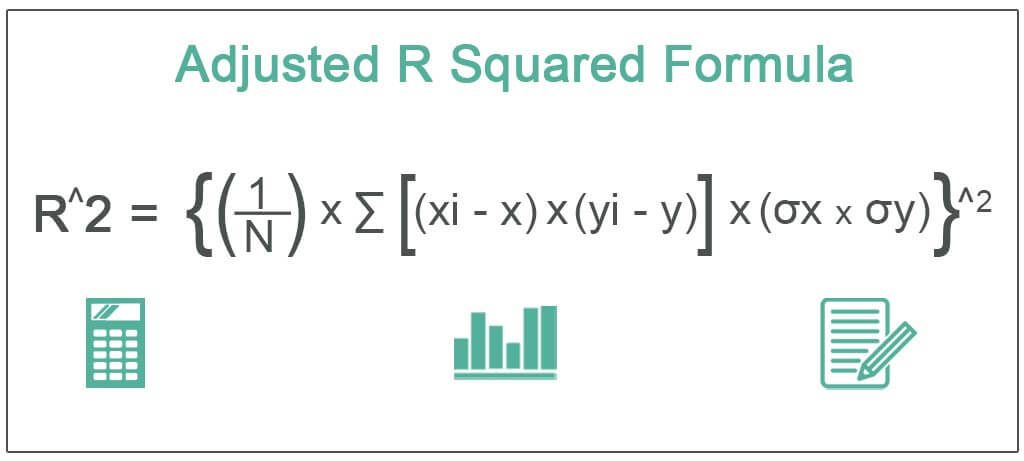
Formula
The formula to calculate the adjusted R square value is as below. This formula shall act as the basis for our understanding of this concept and its intricacies.
Where,
- R^2= adjusted R square of the regression equation
- N= Number of observations in the regression equation
- Xi= Independent variable of the regression equation
- X= Mean of the independent variable of the regression equation
- Yi= Dependent variable of the regression equation
- Y= Mean of the dependent variable of the regression equation
- σx = Standard deviation of the independent variable
- σy = Standard deviation of the dependent variable.
Please Note
For calculating it in Excel, it needs to be provided with y and x variables in Excel, and Excel generates the whole output along with Adjusted R^2. It is a case where it is difficult to provide the work in text format, unlike other formulas.
How To Calculate?
An adjusted R Square calculator determines the extent of the variance of the dependent variable, which the independent variable can explain. By looking at the adjusted R^2 value, one can judge whether the data in the regression equation is a good fit. The higher the adjusted R^2 the better the regression equation as it implies that the independent variable chosen to determine the dependent variable can explain the variation in the dependent variable.
The value of the modified R^2 can also be negative, though it is not always negative. In the adjusted R square, the value of the adjusted R square will go up with the addition of an independent variable only when the variation of the independent variable impacts the variation in the dependent variable. It is not applicable in the case of R^2, only relevant to the value of adjusted R^2.
Examples
Now that we understand the basics of the concept and its related factors, let us put that theoretical knowledge into practical application through the examples below.
Example #1
Let us try and understand the concept of adjusted R^2 with the help of an example. First, let us try to find out the relation between the distance covered by the truck driver and the age of the truck driver. Then, someone does a regression equation to validate whether what he thinks of the relationship between two variables is also validated by the regression equation.
In this particular example, we will see which variable is the dependent variable and which variable is the independent variable. The dependent variable in this regression equation is the distance covered by the truck driver, and the independent variable is the age of the truck driver. By running a regression with the variables, we got the adjusted R square to be 65%. The snapshot below depicts the regression output for the variables. The data set and the variables are presented in the Excel sheet attached.
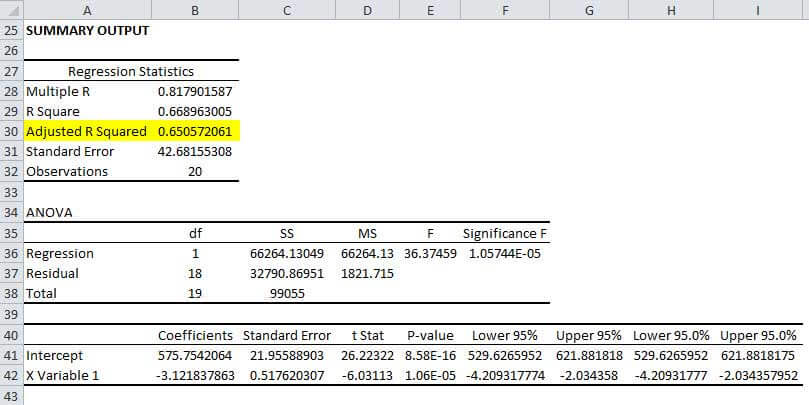
The adjusted R^2 value of 65% for this regression implies that the independent variable explains 65% of the variation in the dependent variable. Ideally, a researcher will look for the coefficient of determination closest to 100%.
Example #2
Let us try and understand the concept of adjusted R square with the help of another example. Let us try to find out the relation between the height of the students of a class and the GPA grade of those students. In this particular example, we will see which variable is the dependent variable and which variable is the independent variable. The dependent variable in this regression equation is the student’s GPA, and the independent variable is the height of the students.
By running a regression with the variables, we got the adjusted R^2 to be negligible or negative. The snapshot below depicts the regression output for the variables. The data set and the variables are presented in the Excel sheet attached.
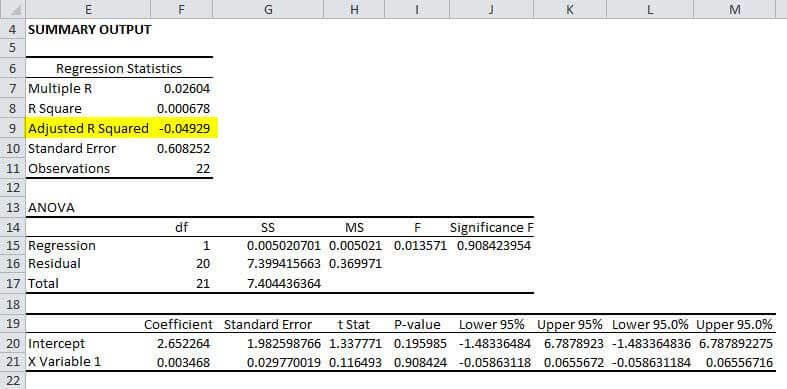
The adjusted R^2 value is negligible for this regression, which implies that the independent variable does not explain the variation in the dependent variable. Ideally, a researcher will look for the coefficient of determination closest to 100%.
Adjusted R Squared Vs R Squared
Let us understand the key differences between these two concepts that are used to determine the correlation of a particular investment. Despite their similar uses, there are differences in their fundamentals and implications. Let us understand them through the comparison below.
Adjusted R Squared
- Adjusted R squared only r=increases in value when an additional variable is significant to the initial model.
- It can be used to compare models with multiple independent variables.
- It can be used to select vital predictors for a regression model.
- Since it compares multiple independent variables against the specific index, it is more accurate than its counterpart. Hence, it is preferred by investors and traders.
R Squared
- Every time an independent variable is added to a model, the r-squared value increases even if the new addition is insignificant. This value never declines.
- There is no way to determine if the predictions and coefficient estimates are biased.
- In situations such as multiple linear regression, this metric cannot empower the trader or investor with the knowledge of which regression variable is more significant or important.
Recommended Articles
This article is a guide to what is Adjusted R Squared. Here we explain its formula, and how to calculate, interpretation, and compared it with R squared. You can learn more about statistical modeling from the following articles: –