Part of our Hypothesis Testing guide
What Is The P-Value Formula?
The P-value formula is the expression that helps calculate the P-value, which is the abbreviated form for probability. It is a statistical measure that helps researchers to determine whether their hypothesis is correct. In addition, it helps determine the significance of the results. The null hypothesis is a default position that there is no relationship between two measured phenomena. H0 denotes it.
An alternative hypothesis is the one you would believe if the null hypothesis is untrue. Its symbol is H1 or Ha. P-value in excel is a number between 0 and 1. In addition, tables, spreadsheet programs, and statistical software help calculate the P-value. The significance level (α) is a predefined threshold the researcher sets. It is generally 0.05.
Key Takeaways
- The probability that a null hypothesis will hold true, be accepted, or be rejected is determined by the P-Value, also known as the Probability Value.
- The presumptive outcome rejection is the alternate result acceptance.
- A higher P-Value denotes a very high likelihood of the predicted outcome occurring. Additionally, it indicates that the alternative outcome is more likely to occur
- It implies that the likelihood of that result happening is real and that the outcome will favour the desired end. A low value, on the other hand, indicates that there is little possibility that the desired or assumed consequence will occur.
- This result is immediately rejected if the anticipated or necessary result has a low value, but the alternative result is automatically accepted.
P-Value Formula Explained
The P-value formula provides for the equation that helps find out whether the hypothesis is correct or incorrect. It indicates the probability of a result to get exactly repeated or being similar in traits to the actual observation. The P-value formula helps derive the calculation expressions using P-value tables, spreadsheets, or statistical software. It depicts the deviation between the values that are observed and the reference value.
A very small P-value, which is lesser than the significance level, indicates that you reject the null hypothesis. The P-value, greater than the significance level, indicates that we fail to reject the null hypothesis. If the difference between two observed values is greater, it depicts that the reason behind the difference is a simple random chance. This is indicated by a lower p-value.
How To Calculate?
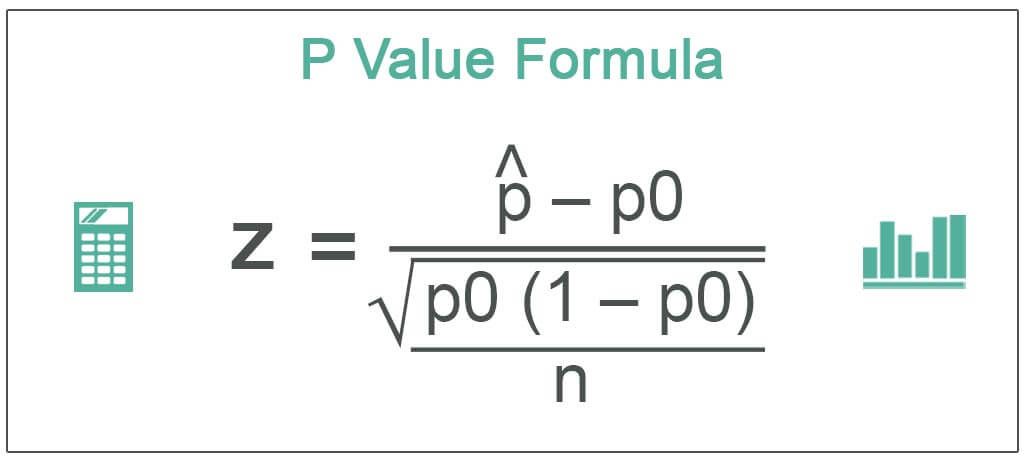
To derive the value of P from the P-value formula, one must calculate the Z-statistic. So, one can derive the formula for the calculation of the P-value by using the following steps:
Step 1: We need to find out the test statistic z
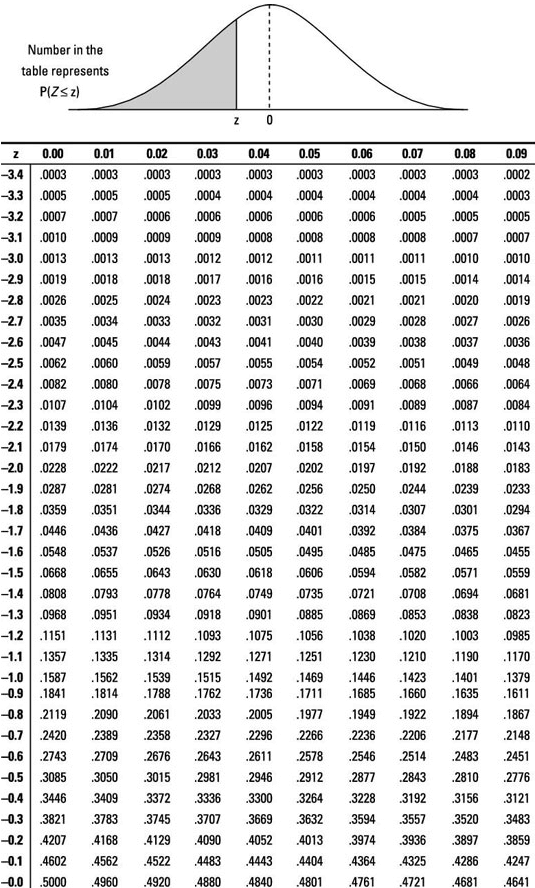
Source: www.dummies.com
For instance, let us find the value of p corresponding to z ≥ 2.81. Since the normal distribution is symmetric, the negative values of z are equal to their positive values. 2.81 is a sum of 2.80 and 0.01. Look at 2.8 in the z column and the corresponding value of 0.01. We get p = 0.0025.
Examples
Let us see some simple to advanced examples of the P-Value equation to understand it better.
Example #1
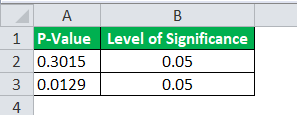
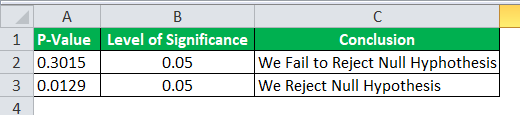
a) Since the P-Value of 0.3015 is greater than the significance level of 0.05 (5%), we fail to reject the null hypothesis.
b) Since the P-Value of 0.0129 is less than the level of significance of 0.05, we reject the null hypothesis.
Solution:
Use the following data for the calculation of P-Value.
P-Value will be –
a) Since the p-value of 0.3015 is greater than the level of significance of 0.05 (5%), we fail to reject the null hypothesis.
b) Since the p-value of 0.0129 is less than the level of significance of 0.05, we reject the null hypothesis.
Example #2
27% of people in India speak Hindi, as per a research study. A researcher is curious if the figure is higher in his village. Hence, the frames the null and alternative hypotheses. He tests H0: p = 0.27. Ha: p > 0.27. Here, p is the proportion of people in the village who speak Hindi. He commissions a survey in his village to find out the number of people who can speak Hindi. He finds that 80 out of 240 people sampled can speak Hindi. Find out the approximate P-Value for the researcher’s test if we were to assume that the necessary conditions are met, and the significance level is 5%.
Solution:
Use the following data for the calculation of P-Value.
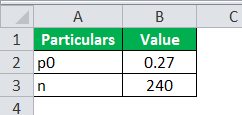
Here, the sample size n = 240,
p0 is the population proportion. We will have to find the sample proportion
![]() = 80 / 240
= 80 / 240
![]() = 0.33
= 0.33
Z Statistic
Calculation of Z Statistic
=0.33 – 0.27 / √ 0.27 * (1 – 0.27 ) / 240
Z Statistic will be –
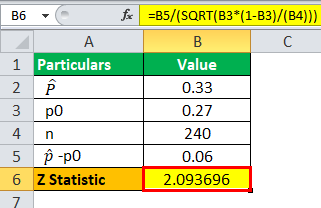
Z = 2.093696
P-Value will be –

P-Value = P (z ≥ 2.09)
We have to look at the value of 2.09 in the Z table. So, we have to look at -2.0 in the z column and the value in the 0.09 column. Since the normal distribution is symmetrical, the area to the right of the curve is equal to that on the left. So, we get the P-Value as 0.0183.
P Value = 0.0183
Since the P-Value is less than the significant level of 0.05 (5%), we reject the null hypothesis.
Example #3
Studies show that males buy a higher number of flight tickets as compared to females. Males and females buy them in a ratio of 2:1. The research was carried out at a particular airport in India to find the distribution of air tickets among males and females. Out of 150 tickets, 88 were bought by males and 62 by females. We need to determine if the experimental manipulation causes the change in the results or if we are observing a chance variation. Calculate the P-Value assuming the degree of significance is 0.05.
Solution:
Use the following data for the calculation of P-Value.
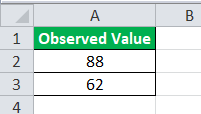
Step 1: The observed value is 88 for males and 62 for females.
- Expected Value for males = 2/3* 150 = 100 males
- Expected Value for females = 1/3* 150 = 50 females
Step 2: Find out chi-square
=((88-100)2)/100 + (62-50) 2/50
=1.44+2.88
Chi-Square (X^2)
Chi-Square(X^2) will be –
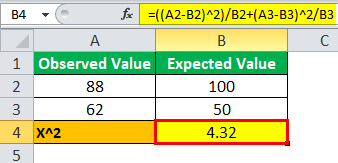
Chi-Square(X^2) = 4.32
Step 3: Find the degrees of freedom
Since there are 2 variables – males and females, n=2
Degrees of freedom = n-1 = 2-1 = 1
Step 4: From the P-Value table, we look at the first row in the table as the degree of freedom is 1. We can see that the P-Value is between 0.025 and 0.05. Since the P-Value is less than the degree of significance of 0.05, we reject the null hypothesis.
P-Value will be –
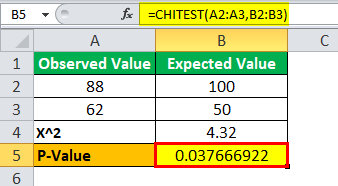
P Value = 0.037666922
Note: Excel directly gives the p-value using the formula:
CHITEST (actual range, expected range)
Example #4
It is known that 60% of the people who enter apparel stores in a city purchase something. An apparel shop owner wanted to find out if the number is higher for his apparel shop. He already had the results of a study conducted for his shop. 128 out of 200 people who entered his shop purchased something. The shop owner denoted the proportion of people who entered his apparel shop and purchased something. The null hypothesis he framed was p = 0.60, and the alternate hypothesis was p > 0.60. Find the P-Value for the research at a significance level of 5%.
Solution:
Use the following data for the calculation of P-Value.
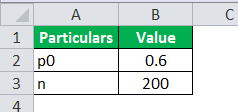
Here, the sample size n = 200. We will have to find the sample proportion
= 128 / 200
![]() = 0.64
= 0.64
Z Statistic
Calculation of Z Statistic
= 0.64 – 0.60 / √ 0.60 * (1 – 0.60) /200
Z Statistic will be –
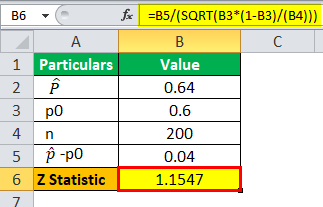
Z Statistic =1.1547
P Value = P (z ≥ 1.1547)
NORMSDIST Function in Excel
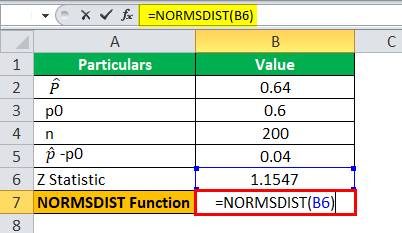
NORMSDIST will be –

NORMSDIST = 0.875893461
There is an inbuilt function to calculate a P-Value from a Z Statistic in Excel. It is known as the NORMSDIST function. The Excel NORMSDIST function calculates the standard normal cumulative distribution Function from a supplied value. Its format is NORMSDIST(z). Since the z-statistic value is in cell B2, the function used is = NORMSDIST(B2).
P Value will be –
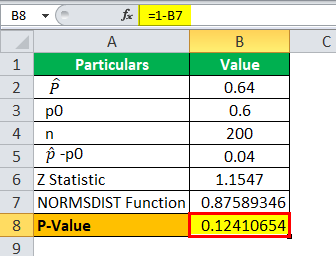
P Value = 0.12410654
Since we have to find the area to the right of the curve,
P-Value = 1 – 0.875893 = 0.124107.
Since the P-Value of 0.124107 is more than a significant level of 0.05, we fail to reject the null hypothesis.
Relevance and Use
The P-value formula is used by users in various ways. Besides, refuting the null hypothesis, when that hypothesis holds true.
P-Value has wide applications in statistical hypothesis testing, specifically null hypothesis testing. For instance, a Fund Manager runs a mutual fund. He claims that the returns from a particular mutual fund scheme are equivalent to Nifty, the benchmark stock market index. Therefore, he would frame the null hypothesis that the returns of the mutual fund scheme are equivalent to that of Nifty. The alternative hypothesis is that the Scheme and Nifty returns are not equivalent. He would then calculate the P-Value.
Frequently Asked Questions (FAQs)
How to interpret P-value?
The null hypothesis is assumed to be true, and the p-value determines the likelihood of having the results that were observed; the statistical significance of the difference that was discovered grows with decreasing p-value. The standard definition of statistical significance is a p-value of 0.05 or less.
When are P-values negative?
Numerous papers in medical journals have noted that studies are regarded as positive if the P value is less than 0.05 and as negative if the P value is greater than 0.05.
Where is the P-value in SPSS?
The p-value is labeled as “Sig.” in the SPSS output (“Sig.” stands for significance level). To find the correct “Sig.”, look in the section of the “Independent Samples Test” output labeled “t-test for Equality of Means” and you will find a column labeled “Sig.
Recommended Articles
This article has been a guide to what is the P-Value Formula. Here, we explain the concept along with how to calculate it, examples, relevance, and uses. You can learn more about Excel modeling from the following articles: –