Definition of F-Test Formula
The F-test formula one may use to perform the statistical test that helps the person conducting the test find whether the two population sets having the normal distribution of the data points have the same standard deviation.
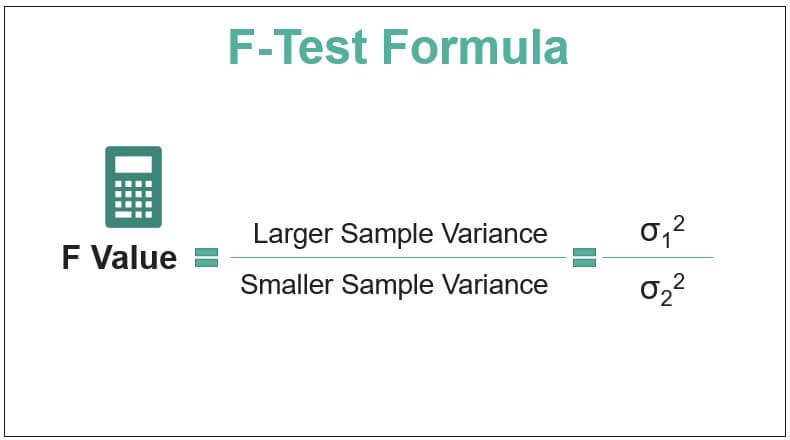
F-Test is any test that uses F-distribution. F-value is a value on the F-distribution. Various statistical tests generate an F value. The value can determine whether the test is statistically significant. For example, to compare two variances, one has to calculate the ratio of the two variances, which is as under:
F Value = Larger Sample Variance / Smaller Sample Variance = σ12 / σ22
While F-test in Excel, we need to frame the null and alternative hypotheses. Then, we need to determine the level of significance under which the test has to carry. Subsequently, we must determine the degrees of freedom of the numerator and denominator. It will help determine the F-table value. The F-value seen in the table is then compared to the calculated F-value to determine whether or not to reject the null hypothesis.
Key Takeaways
- The F-test formula is used to conduct a statistical test determining whether two population sets with normally distributed data points have the same standard deviation.
- The F-test can be used to test the hypothesis of equal variances between two populations.
- It can also be used to test the hypothesis of equal means between normally distributed populations with the same standard deviation.
- The F-test is commonly employed to assess the fit of a proposed regression model to the data, evaluating how well the model explains the variability in the data.
Step by Step Calculation of an F-test
Below are the steps where the F-Test formula is used for the null hypothesis that the variances of two populations are equal:
- Firstly, frame the null and alternate hypothesis.
The null hypothesis assumes that the variances are equal.H0: σ12= σ22. The alternate hypothesis states that the variances are unequal.H1: σ12≠σ22. Here, σ12and σ22are the symbols for variances.
- Calculate the test statistic.
(F distribution). i.e., =σ12/σ22Whereσ12is assumed to be larger sample variance, andσ22is the smaller sample variance
- Calculate the degrees of freedom.
Degree of freedom (df1) = n1 – 1 and Degree of freedom (df2) = n2 – 1 where n1 and n2 are the sample sizes.
- Look at the F value in the F table.
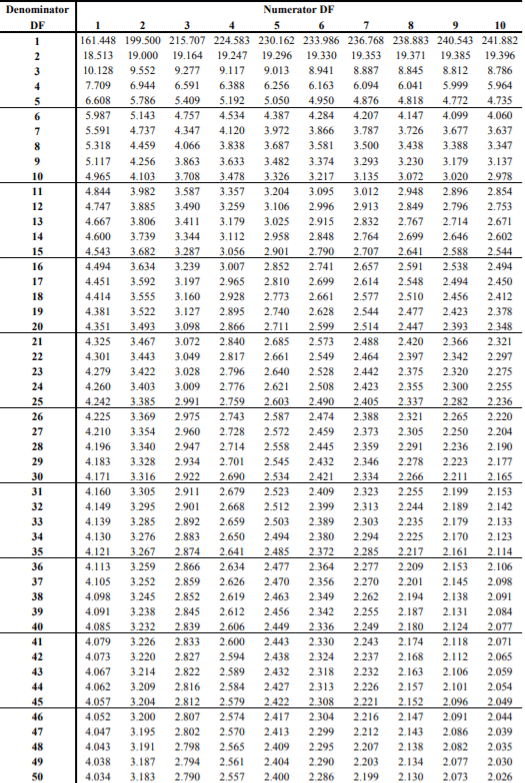
For two-tailed tests, divide the alpha by 2 to find the correct critical value. Thus, the F-value is found by looking at the degrees of freedom in the numerator and the denominator in the F-table. Df1 is read across in the top row. Df2 is read down in the first column.Note:There are different F Tables for different levels of significance. Above is the F table for alpha = .050.

- Compare the F statistic obtained in Step 2 with the critical value obtained in Step 4. We reject the null hypothesis if the F statistic exceeds the critical value at the required significance level. If the F statistic obtained in Step 2 is less than the critical value at the required significance level, we cannot reject the null hypothesis.
Examples
Example #1
A statistician was carrying out an F-Test. He got the F statistic as 2.38. The degrees of freedom obtained by him were 8 and 3. Find out the F value from the F Table and determine whether we can reject the null hypothesis at a 5% significance level (one-tailed test).
Solution:
We must look for 8 and 3 degrees of freedom in the F Table. The F critical value obtained from the table is 8.845. Since the F statistic (2.38) is lesser than the F Table Value (8.845), we cannot reject the null hypothesis.
Example #2
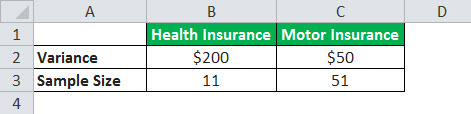
An insurance company sells health insurance and motor insurance policies. Customers pay premiums for these policies. The CEO of the insurance company wonders if premiums paid by either of the insurance segments (health insurance and motor insurance) are more variable than another. He finds the following data for premiums paid:
Conduct a two-tailed F-test with a level of significance of 10%.
Solution:
- Step 1: Null Hypothesis H0: σ12 = σ22
Alternate Hypothesis Ha: σ12 ≠ σ22
- Step 2: F statistic = F Value = σ12 / σ22 = 200/50 = 4
- Step 3: df1 = n1 – 1 = 11-1 =10
df2 = n2 – 1 = 51-1 = 50
- Step 4: Since it is a two-tailed test, alpha level = 0.10/2 = 0.050. The F value from the F Table with degrees of freedom as 10 and 50 is 2.026.
- Step 5: Since F statistic (4) is more than the table value obtained (2.026), we reject the null hypothesis.
Example #3
The bank has a head office in Delhi and a branch in Mumbai. There are long customer queues at one office, while customer queues are short at the other. The Operations Manager of the bank wonders if the customers at one branch are more variable than the number of customers at another. He carries out a research study of customers.
The variance of Delhi head office customers is 31, and that for the Mumbai branch is 20. The sample size for the Delhi head office is 11, and that for the Mumbai branch is 21. Carry out a two-tailed F-test with a level of significance of 10%.
Solution:
- Step 1: Null Hypothesis H0: σ12 = σ22
Alternate Hypothesis Ha: σ12 ≠ σ22
- Step 2: F statistic = F Value = σ12 / σ22 = 31/20 = 1.55
- Step 3: df1 = n1 – 1 = 11-1 = 10
df2 = n2 – 1 = 21-1 = 20
- Step 4: Since it is a two-tailed test, alpha level = 0.10/2 = 0.05. The F value from the F Table with degrees of freedom as 10 and 20 is 2.348.
- Step 5: Since the F statistic (1.55) is lesser than the table value obtained (2.348), we cannot reject the null hypothesis.
Relevance and Uses
One can use the F-Test formula in a wide variety of settings:
- The F-Test is used to test the hypothesis that the variances of two populations are equal.
- It is used to test the hypothesis that the means of given normally distributed populations with the same standard deviation are equal.
- It is used to test the hypothesis that a proposed regression model fits the data well.
F-Test Formula in Excel (with Excel Template)
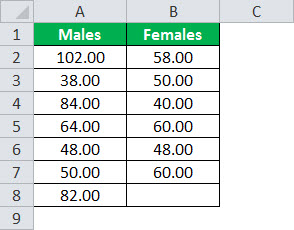
Workers in an organization pay daily wages. However, the organization’s CEO is concerned about the wage variability between males and females in the organization. Below are the data taken from a sample of males and females.
Conduct a one-tailed F-Test at a 5% level of significance.
Solution:
- Step 1: H0: σ12 = σ22, H1: σ12 ≠ σ22
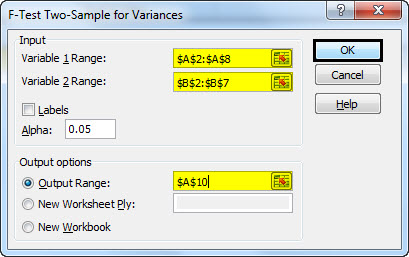
- Step 2: Click on Data Tab > Data Analysis in Excel.

- Step 3: The below-mentioned window will appear. Select “F-Test Two-Sample for Variances” and then click on “OK.”

- Step 4: Click on the “Variable 1 Range” box and select the range A2:A8. Click on the “Variable 2 Range” box and select the range B2: B7. Click A10 in the “Output Range.” Select 0.05 as “Alpha” as a significance level is 5%. Then, click on “OK.”
It will display the values for F statistic and F table value along with other data.
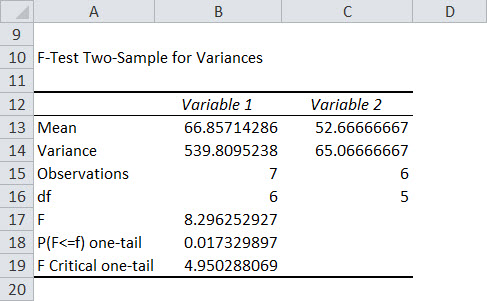
- Step 4: From the above table, we can see F statistic (8.296) is greater than F critical one-tail (4.95), so we will reject the null hypothesis.
Note 1: The variance of “Variable 1” has to be higher than that of “Variable 2.” Otherwise, calculations made in Excel will be wrong. If not, then swap the data.
Note 2: If the “Data Analysis” button is unavailable in Excel, go to File > Options. Under Add-ins, select Analysis ToolPak and click on the Go button. Next, check “Analysis Tool Pack” and click on “OK.”
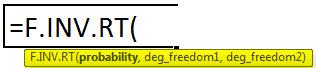
Note 3: Excel uses a formula to calculate the F table value. Its syntax is:
Frequently Asked Questions (FAQs)
What are the limitations of the F-test?
The F-test assumes that the data follows a normal distribution and that the variances of the compared populations are equal. Violations of these assumptions can lead to incorrect results. Additionally, the F-test is sensitive to sample size, meaning it may produce unreliable results with small sample sizes.
Is the F-test parametric or nonparametric?
The F-test is a parametric test, as it makes assumptions about the underlying distribution of the data. Specifically, it assumes that the data follows a normal distribution.
What is the difference between the F-test and the T-test?
The F-test and t-test are both statistical tests but serve different purposes. The F-test is used to compare variances or test the fit of a regression model, while the t-test is used to compare means between two groups. The F-test is typically used for testing multiple groups or comparing multiple variances, while the t-test is used for comparing means between two groups.
Recommended Articles
This article is a guide to F-Test Formula. Here, we learn how to perform an F-Test to determine whether or not to reject the null hypothesis, along with examples and a downloadable Excel template. You can learn more about statistical modeling from the following articles: –