What Is P-Value?
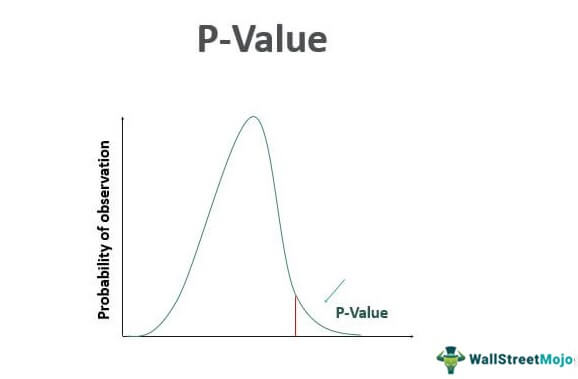
P-Value, or the Probability Value, is the determining factor on a null hypothesis for the probability of an assumed result to be true and being accepted or rejected and acceptance of the alternate result in case of rejection of the assumed result.
Statisticians refer to this value for more relevant results. In most cases, it lies within a range of 0 – 0.05 (5%) and has a negative result, which means the alternate result would be considered, and a value higher than 0.05 signifies that it will accept the desired result. However, this will not be hard and fast for all cases and will depend upon the conditions and product.
Key Takeaways
- P-Value, also called the Probability Value, is the analyzing factor on a null hypothesis for the probability of an assumed result to be true and being accepted or rejected and acceptance of the alternate result in rejection of the assumed result.
- One may use it when making a difficult decision, leading to severe losses. For example, finding a P-value makes it easier to determine between two options.
- The P-Value is similar to the probability of occurrence of the desired result.
P-Value Explained
P-Value calculation also includes a probability of other results’ occurrence. However, statisticians refer to this value for more relevant results. In most cases, it lies within a range of 0 – 0.05 (5%) and has a negative result, which means the alternate result would be considered, and a value higher than 0.05 signifies that it will accept the desired result. However, this will not be hard and fast for all cases and will depend upon the conditions and product.
Always a probability of the occurrence of a required result when in a scenario made a null hypothesis.
There is also an alternate result that is existent and holds an equivalent probability. However, it would infer if the assumed/required result fails to prove. The p-value statistics calculation determines whether the assumed result will hold “True” or the alternate result. A higher value determines the acceptance of the assumed result, while a lower signifies the rejection of this assumed result and acceptance of the alternate result.
For example, in a hypothetical situation, we survey a new appliance in the market, and results assume that 60% of females will accept the appliance, with an alternate result expected that 60% of males will accept the appliance. With the help of the p-value chart, we try to determine the results. A higher value will signify that the assumed expected result is “True,” which means 60% of females accept the appliance. Consequently, a lower would imply acceptance of the alternate results, which means 60% of males accept the appliance.
Hence, it determines the acceptance or rejection of an assumed result.
Formula
It can be calculated using z analysis (z test) where:

where,
- P1 = sample proportion of the whole population
- P0 = Assumed proportion for the result to occur
- n = size of the population
The Z-value is predicted from previous calculations. If the p-value statistics is equal to or less than the calculated z value, then the sample can be approved for the desired result (null hypothesis). Else gets rejected, and the alternate result gets approved.
The Z-values have previously calculated values in line with p-value test in the form of tables. With the help of Z-values, the corresponding values are derived from the below table.

Source: https://www.chegg.com/
Example
Let us understand the p-value significance with an example.
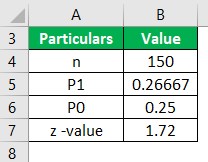
Consider Mr. X’s wishes to invest in a portfolio ABC. However, he feels there is a probability of 25% that this portfolio will earn the desired interest rate, while another portfolio MNO is his alternate choice. He samples from 150 stocks and finds that 40 stocks in portfolio ABC earn the required interest rate. Calculate the P-Value, and assuming that the Z-value is 1.72, find out if the portfolio ABC is suitable for investment or should be rejected.
Solution
From the z-test, it is as follows that:
- P1 = 40/150 = 0.267
- P0 = 0.25 (the assumed proportion for the result to occur)
- n = 150
Hence p-value should be as follows:
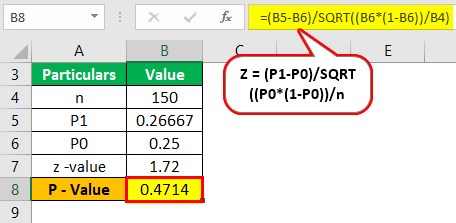
- = (0.26667 – 0.25)/SQRT((0.25*(1-0.25))/150)
- = 0.4714
As per the expected z-value, the P-Value from the above table should be 0.0427, away from the above calculation. Hence, the portfolio ABC gets rejected (the null hypothesis gets rejected).
Interpretation
- A higher p-value significance denotes that the probability of occurrence of the assumed result is very likely. It suggests that the probability ascertained on the occurrence of that result is true, and the outcome will favor the required result. On the contrary, a low value signifies that the required or assumed result has a very low chance of occurrence. It also denotes that the alternate result is more probable to occur. A low value on the assumed or required result automatically rejects this result, and the alternate result is automatically accepted.
Uses
- It is used when making a difficult decision and may lead to serious losses. Finding out a p-value makes it easier to determine between 2 different options.
- It serves as a double-check on probability analysis. For example, in finance, investment decisions depend mainly on the probability of profits and losses. Hence, even after calculating probability, if the p-value test is computed, it ensures that the decision will be in favor.
- Calculation of returns using a p-value chart is a good way of forecasting results. In reality, the futuristic returns cannot be seen today. However, if all constraints are properly measured and this calculation is done, one can forecast results. Hence, it helps calculate future cash flows and go a little further ahead. It will also help in making future financial-related decisions.
Frequently Asked Questions (FAQs)
What P-value is significant?
Suppose the P-value is under . 01, then the results are statistically significant. If it’s below . 005, they are regarded as highly statistically significant.
How to explain P-value to non-statistician?
P-value is a probability, a number between 0 and 1. It is calculated after running a statistical test on data. A small P-value, i.e., < 0.05 in general) The observed results are unusual, assuming they were because of the chance.
Can P-value be negative?
It has been observed in many articles published in medical journals that if the P-value is less than 0.05, the study is considered positive. If the P-value is more than 0.05, it is considered negative.
Should p-values be the sole basis for decision-making?
No, p-values should not be the sole basis for decision-making. They should be considered alongside other relevant factors, such as effect size, study design, context, and prior knowledge. A comprehensive analysis requires interpreting p-values in conjunction with other statistical measures and scientific judgment.
Recommended Articles
This article is a guide to what is P-Value. We explain its formula, interpretation process, along with example and its uses. You may learn more about financing from the following articles: –