T-Test Meaning
A T-test is the final statistical measure for determining differences between two means that may or may not be related. The testing uses randomly selected samples from the two categories or groups. It is a statistical method in which samples are chosen randomly, and there is no perfect normal distribution.
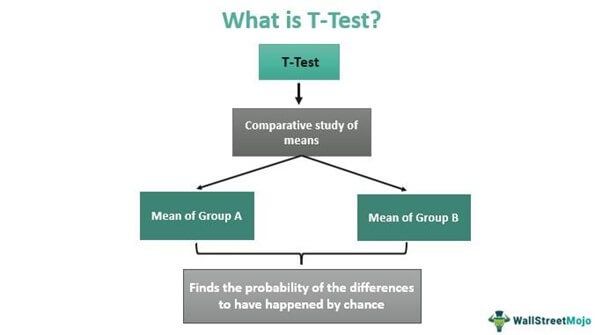
The type of T-test to be conducted is decided by whether the samples to be analyzed are from the same category or distinct categories. The inference obtained in the process indicates the probability of the mean differences to have happened by chance. The test is useful when comparing population age, length of crops from two different species, student grades, etc.
Key Takeaways
- A T-test is a statistical method of comparing the means or proportions of two samples gathered from either the same group or different categories.
- It is aimed at hypothesis testing, which is used to test a hypothesis pertaining to a given population.
- It is the difference between population means and a hypothesized value.
- One-sample, two-sample, paired, equal, and unequal variance are the types of T-tests users can use for mean comparisons.
Video Explanation Of T-Test

T-Test Explained
A T-test studies a set of data gathered from two similar or different groups to determine the probability of the difference in the result than what is usually obtained. The accuracy of the test depends on various factors, including the distribution patterns used and the variants influencing the collected samples. Depending on the parameters, the test is conducted, and a T-value is obtained as the statistical inference of the probability of the usual resultant being driven by chance.
For example, if one wishes to figure out if the mean of the length of petals of a flower belonging to two different species is the same, a T-test can be done. The user can select petals randomly from two other species of that flower and come to a standard conclusion. The final T-test interpretation could be obtained in either of the two ways:
- A null hypothesis signifies that the difference between the means is zero and where both the means are shown as equal.
- An alternate hypothesis implies the difference between the means is different from zero. This hypothesis rejects the null hypothesis, indicating that the data set is quite accurate and not by chance.
This T-test, however, is only valid and should be done when the mean or average of only two categories or groups needs to be compared. As soon as the number of comparisons to be made is more than two, conducting this is not recommended.
Assumptions
The test runs on a set of assumptions, which are as follows:
- The measurement scale used for such hypothesis testing follows a set of continuous or ordinal patterns. The accounted parameters and variants influencing the samples and surrounding the groups are based on the standard consideration.
- The tests are completely based on random sampling. As no individuality is maintained in the samples, the reliability is often questioned.
- When the data is plotted with respect to the T-test distribution, it should follow a normal distribution and bring about a bell-curved graph.
- For a clearer bell curve, the sample size needs to be bigger.
- The variance should be such that the standard deviations of the samples are almost equal.
Types
Some of the widely used T-test types are as follows:

#1 – One-Sample T-Test
While performing this test, the mean or average of one group is compared against the set average, which is either the theoretical value or means of the population. For example, a teacher wishes to figure out the average height of the students of class 5 and compare the same against a set value of more than 45 kgs.
The teacher first randomly selects a group of students and records individual weights to achieve this. Next, she finds out the mean weight for that group and checks if it meets the standard set value of 45+. The formula used to obtain one-sample t-test results is:

Where,
- T = t-statistic
- m = mean of the group
- = theoretical mean value of the population
- s = standard deviation of the group
- n = sample size
#2 – Independent Two-Sample T-Test
This is the test conducted when samples from two different groups, species, or populations are studied and compared. It is also known as an independent T-test. For example, if a teacher wants to compare the height of male students and female students in class 5, she would use the independent two-sample test.
The T-test formula used to calculate this is:
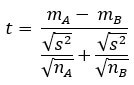
Where,
- mA – mB = means of samples from two different groups or populations
- nA – nB = respective sample sizes
- s2 = standard deviation or common variance of two samples
#3 – Paired Sample T-Test
This hypothesis testing is conducted when two groups belong to the same population or group. The groups are studied either at two different times or under two varied conditions. The formula used to obtain the t-value is:

Where,
- T = t-statistic
- m = mean of the group
- = theoretical mean value of the population
- s = standard deviation of the group
- n = sample size
#4 – Equal Variance T-Test
This test is conducted when the sample size in each group or population is the same or the variance of the two data sets is similar. It is also referred to as pooled T-test. The formula applied here is as follows:

Where,
- Mean1 and mean2 = average value of each set of samples
- var1 and var2 = variance of each set of samples
- n1 and n2 = number of records in each set
#5 – Unequal Variance T-Test
The unequal variance testing is used when the variance and the number of samples in each group are different. It is often referred to as Welch’s test, and the formula is:

Where,
- mean1 and mean2 = Average value of each set of samples
- var1 and var2 = Variance of each set of samples
- n1 and n2 = number of records in each set
Example With Calculation
Let us consider the scores for each subject in the examination held in two phases.
| Subject | Marks Phase 1 | Marks Phase 2 |
| Maths | 45 | 62 |
| Physics | 45 | 55 |
| Chemistry | 45 | 55 |
| Biology | 50 | 65 |
| History | 55 | 68 |
| Geography | 80 | 70 |
Step 1: Subtract the marks scored in both the phases

Step 2: Add up all the differences, i.e., -55
Step 3: Square up the differences

Step 4: Add up all the squares of difference, i.e., 983
Step 5: Usage of formula to calculate the T value

- = -9.16/√ {983-(-55)2/6)}/ (6-1) *6
- = -9.16/√15.96
- = -9.16/3.99
T Value = -2.29
Now, get the degrees of freedom. To obtain this, subtract 1 from the sample size (6 – 1 =5). The next thing is to find out the p-value, which, if smaller in value, supports the null hypothesis result. For example, if the p-value is something around 0.9, i.e., 90%, it indicates that the T-value obtained has the probability of being a random observation. On the other hand, if the p-value is around 0.025, i.e., 2.5%, the result or t-value obtained is significant.
Frequently Ask Questions (FAQs)
What is a T-Test?
T-test measures the difference between two means, which may or may not be related to each other, indicating the probability of the differences to have happened by chance. The accuracy of the values obtained depends on various factors, including the distribution patterns used and the variants influencing the collected samples.
When is the T-Test used?
A T-Test is only valid and should be done when means of only two categories or groups need to be compared. As soon as the number of comparisons to be made is more than two, conducting this test is not recommended.
• One-sample is used to find out the mean or average of one group to compare it against the set average.
• An independent Two-Sample test is conducted when samples from two different groups, species, or populations are studied and compared.
• Paired Sample is the hypothesis testing conducted when two groups belong to the same population or group.
• Equal Variance is conducted when the sample size in each group or population is the same, or the variance of the two data sets is similar.
• Unequal Variance is used when the variance and the number of samples in each group are different.
What are T-Tests and P values?
While the T values indicate the chances of the difference between the sample means being a result obtained by chance, p-values reflect the probability of having sufficient proof to negate the indifference between the mean of the two samples.
Recommended Articles
This has been a guide to What is T-Test & its Meaning. Here we explain how T-Test works along with its formula, calculation, types, assumptions, and examples. You can learn more about from the following articles –