What is Hypothesis Testing?
Hypothesis testing ascertains whether a particular assumption is true for the whole population. It is a statistical tool. It determines the validity of inference by evaluating sample data from the overall population.
The concept of hypothesis works on the probability of an event’s occurrence. It confirms whether the primary hypothesis results are correct or not. It is widely applied in research—biology, criminal trials, marketing, and manufacturing.
Key Takeaways
- Hypothesis testing is a statistical interpretation that examines a sample to determine whether the results stand true for the population.
- The test allows two explanations for the data—the null hypothesis or the alternative hypothesis. If the sample mean matches the population mean, the null hypothesis is proven true.
- Alternatively, if the sample mean is not equal to the population mean, the alternate hypothesis is accepted.
- This method requires superior analytical abilities and, therefore, is inaccessible for most. Also, this method heavily relies on probability.
Hypothesis Testing in Statistics Explained
Hypothesis testing uses sample data to validate the research. Researchers speculate on relationships between various factors. They then collect data to test those relationships. Based on the data, researchers draw conclusions. In statistics, it is very important to eliminate randomness. The data should not have been caused by chance or a random factor. Hypothesis testing eliminates such uncertainties.
For every research experiment, there are mainly two explanations: the null hypothesis and the alternative hypothesis. It is often difficult to prove a theory; therefore, investigators test to reject the null hypothesis. So, when the null hypothesis is rejected, the remaining alternate theory is believed to be true.
For example, if we believe that the returns from the NASDAQ stock index are not zero. Then the null hypothesis would state: ‘the recovery from the NASDAQ is zero.’ Tests are conducted for different levels of statistical significance.
Hypothesis tests are prone to two errors—type 1 and type 2. If the null hypothesis is rejected by the sample outcome despite being true—it is considered a type 1 error. Similarly, if the sample data fails to reject the null hypothesis, despite the null hypothesis being false, it is considered a type 2 error.
Hypothesis Testing Types
Based on population distribution, hypothesis testing is further categorized into sub-types:
- Simple: In a simple hypothesis, the population parameter is stated as a specific value, making the analysis easier.
- Composite: In a composite hypothesis, the population parameter ranges between a lower and upper value.
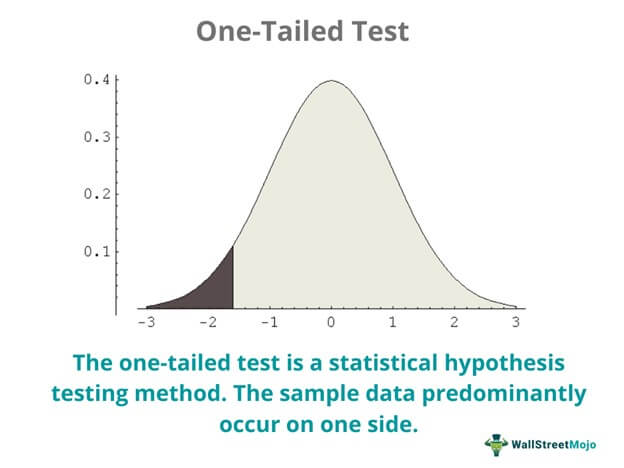
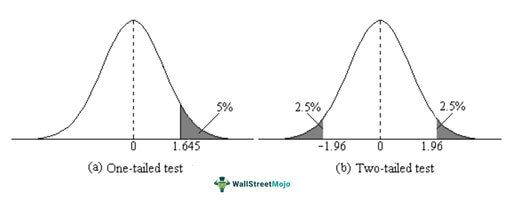
- One-tailed: When the majority of the population is concentrated on one side, it is called a one-tailed test. In a one-tailed test, the sample test is either higher or lower than the population parameter.
- Two-tailed: The two-tailed hypothesis test works when the critical distribution of the population is two-sided. Here the test sample is either higher or lower than a number of given values.
Hypothesis Testing Steps
Hypothesis tests involve the following steps:
- Researchers first mention whether the idea is a null theory or an alternative hypothesis. If the variables are not correlated, then it is assumed null. Alternatively, if the variables show correlation, then it is the alternative hypothesis.
- Then they collect relevant data for sampling—it closely represents the whole population on which the test is to be performed.
- Next, researchers choose a statistical test that suits the collected data.
- Based on the test results and level of significance, they either accept or reject the null hypothesis.
- Finally, the statistical findings are compiled and summarized into a research report.
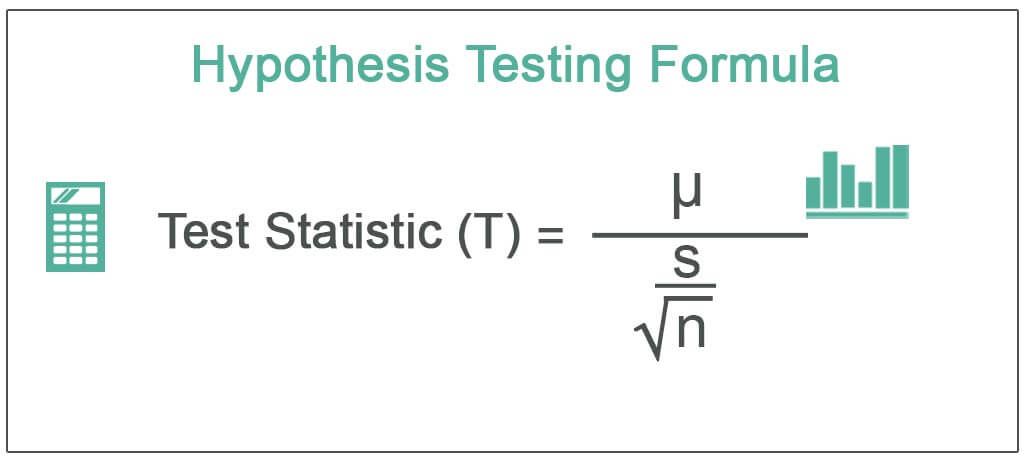
Hypothesis Testing Formula
Researchers opt for different statistical tests like t-tests or z-tests. The z-test formula is as follows:
Z = ( x̅ – μ0 ) / (σ /√n)
- Here, x̅ is the sample mean,
- μ0 is the population mean,
- σ is the standard deviation,
- n is the sample size.
Based on the Z-test result, the research derives the hypothesis conclusion. It can either be a null or its alternative. They are measured using the following formula:
H0: μ=μ0
Ha: μ≠μ0
Here,
H0 = null hypothesis
Ha = alternate hypothesis
If the mean value is equal to the population mean, then the null hypothesis is proven true. Otherwise, the alternate hypothesis is taken into consideration.
Hypothesis Testing Calculation with Examples
A battery manufacturing company claims that the average life of its two-wheeler batteries is 2.1 years. The quality inspector surveyed ten customers to know the lasting period of their batteries. The following data was collected:
| Customer No. | Battery Life (in years) |
| 1 | 1.9 |
| 2 | 2.3 |
| 3 | 2.1 |
| 4 | 2.2 |
| 5 | 1.9 |
| 6 | 2.4 |
| 7 | 2.1 |
| 8 | 2.3 |
| 9 | 2.2 |
| 10 | 2.0 |
If the standard deviation is 0.17 and the significance level is 0.05, conduct a hypothesis testing to prove the company’s claim.
Solution:
Given:
μ0= 2.1 years
σ = 0.17
n = 10
Level of Significance = 0.05
Assuming that the company’s claim of average battery life being 2.1 years is true,
We need to prove that:
H0: μ=μ0 , or
Ha: μ≠μ0
Sample mean (x̅) = (1.9 + 2.3 + 2.1 + 2.2 + 1.9 + 2.4 + 2.1 + 2.3 + 2.2 + 2.0) / 10 = 2.14 years.
Applying the Z-test formula:
Z = ( x̅ – μ0 ) / (σ /√n)
Z = (2.14 – 2.1) / (0.17 / √10) = 0.744
We already know that the level of significance is 0.05, and the z-score is 1.645. Let us now compare the Z-test with it.
0.744 ˂ 1.645; therefore, the null hypothesis is true.
Thus, the company’s claim that the average life of its batteries is 2.1 years is proven true.
Relevance and Use
Hypothesis testing validates a theory with the help of systematic statistical inference. However, in practice, it is not easy. Therefore, researchers try to reject the null hypothesis in order to validate the alternate explanation.
Hypothesis testing is widely applied in psychology, biology, medicine, finance, production, marketing, advertising, and criminal trials.
Limitations
Hypothesis testing is all about assumptions and interpretations. It, therefore, requires superior analytical abilities. As a result, it is inaccessible for most.
Also, this method heavily relies on mere probability. There can be errors in data. It works better for large sample sizes. For smaller sample sets, this approach may not be the most suitable.
Frequently Asked Questions (FAQs)
What is P-value in hypothesis testing?
P-value refers to the probability of the null hypothesis getting rejected. P-value calculation determines whether the assumed result will hold true or not. A higher value determines the acceptance of the assumed result, while a lower value signifies rejection of this assumed result and acceptance of the alternate result.
What is the null and alternative hypothesis?
A null hypothesis is a statement that proves that the sample mean is the same as the population mean. An alternative hypothesis is the opposite of the null hypothesis, i.e., it states that there is a difference between the sample mean and the population mean.
Why is hypothesis testing important?
It is a useful statistical tool that interprets data-based conclusions—such that it stands true for the whole population. It is implemented in scientific research, medical research, psychology, manufacturing, marketing, advertising, and criminal trials.
Recommended Articles
This has been a guide to Hypothesis Testing and its meaning. We explain hypothesis testing steps, types, calculation, significance level, p-value, and z-test using examples. You can learn more about excel modeling from the articles below –