Producer Price Index Definition
The Producer Price Index (PPI) measures the rate of change in the prices of products sold by producers over a period of time. It records fluctuation in the product prices at the producer level. Therefore, it is used to track the rate of inflation in an economy. Businesses and policymakers rely on PPI to make informed decisions.
Unlike the consumer price index (CPI), the product prices in PPI do not include any taxes, trade, or transport margins that buyers have to pay. Instead, PPI prices reflect the changes in production costs. However, these changes eventually get passed on to consumers and are reflected in CPI. Thus, both PPI and CPI are popular measures of inflation. The US Bureau of Labor Statistics (BLS) publishes the PPI figures at regular intervals based on the data from industries operating in the goods-manufacturing sector.
Key Takeaways
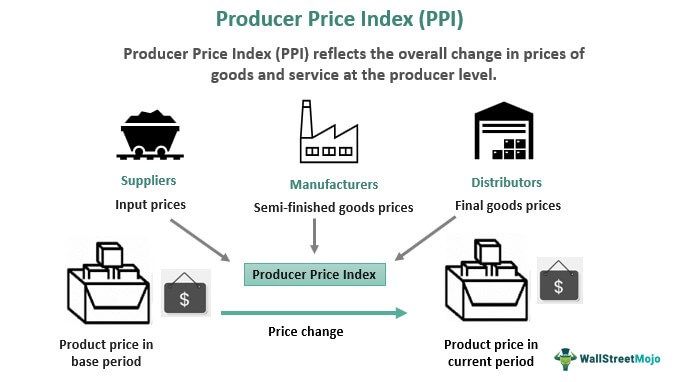
- Producer Price Index (PPI) reflects the overall change in prices of goods and services at the producer level.
- It includes price changes of inputs, semi-finished products, and finished goods and services.
- PPI is used to measure the rate of inflation in an economy.
- The Bureau of Labor Statistics (BLS) publishes the PPI figures at regular intervals.
- BLS uses the Laspeyres Index formula to calculate PPI.
- PPI classifies the price changes on the basis of three broad structures – Industry-level classification, Commodity classification, and Final Demand – Intermediate Demand (FD-ID).
Producer Price Index Explained
Producer Price Index chart enables the market to be aware of the changing prices of the products that leave the producers. It is a collection of approximately 10,000 indices used to gauge the rate of inflation in an economy. PPIs are available for the output of several manufacturing and services industries.
Formerly known as the Wholesale Price Index (WPI) in the US, the PPI records the prices of the products and services paid in the first commercial transaction involved. It reflects the changes in the prices of raw materials or inputs, semi-finished items, or finished goods.
When the input price rises, the price of semi-finished and finished goods also increases. The producer absorbs some portion of it, while the rest is passed on to consumers. As a result, the product prices surge, causing price inflation.
As the PPI throws a direct impact on consumer prices, PPI figures are directly linked to identifying the inflation rate in a nation. Hence, policymakers keep a watch on them to maintain price stability when required.
The PPI program studies the average change in the selling prices over time as received by producers for the output they produce. BSL takes into account approximately 25,000 entities that provide around 100,000 quotations per month. BLS compiles this data to create the PPI.
Note that the core PPI doesn’t include the food and energy prices due to their extremely volatile nature. For example, over the year ending April 2022, the PPI for final demand in the US increased 11%. However, the core PPI for goods rose by 10.1% only. This is because the core PPI excludes food and energy prices that increased by 16.3% and 40%, respectively.
Classification of Prices in PPI
PPI classifies the price changes based on three broad structures – Industry-level classification, Commodity classification, and Final Demand – Intermediate Demand (FD-ID).
- The industry-level PPI classification is done with respect to the changes in the total net output of an industry. This net output marks the aggregate sales price of products produced in an industry that is sold outside that sector.
- Commodity classification refers to the categorization done on the basis of the products and services. PPI identifies and segregates products of an industry depending on the overall similarity, composition, and use.
- FD-ID classification is based on the end-user of the products and services. PPI classifies the price change as a final demand if the end-users are the customers themselves. On the other hand, when the products and services reach customers through channels in between, the price changes are categorized as intermediate demand.
Producer Price Index Formula
Four formulae help calculate Producer Price Index:
Fundamental Formula
PPI = Current price of basket/Base price of basket
Where,
Basket is the relative weight of goods and services in the current or base period.
Laspeyres Formula
This PPI formula weighs goods in proportion to their quantities in the base year.
PPI (Laspeyres) = (∑q_0 × p_t)/(∑q_0 × p_0 ) x 100
Where,
q0 = quantity in the base period
p0 = price of the product in the base period
pt = price of the product in the current year
Paasche Formula
This PPI formula weighs goods in the proportion of their quantities in the current year.
PPI (Paasche) = (∑q_t × p_t)/(∑q_t × p_0 ) x 100
Where,
q0 = quantity in the base period
qt = quantity in the current year
p0 = price of the product in the base period
pt = price of the product in the current year
Fisher Formula
This formula computes PPI as the geometric mean of PPI (Laspeyres Index) and PPI (Paasche Index).
PPI (Fisher) = √(Laspeyres Index X Paasche Index)
= √(((∑q_0 × p_t)/(∑q_0× p_0 ) x 100 ) X ((∑q_t × p_t)/(∑q_t × p_0 ) x 100) )
Among these formulae, BLS uses the Laspeyres Index formula to calculate PPI.
Example
Here is a producer price index example to understand the calculation in a better way.
Let’s calculate the PPI for the year 2020 based on the price changes recorded in the chart below:
| Quantity in 2010 (q0) | Quantity in 2020 | Price in 2010 (p0) | Price in 2020 (pt) |
| 15 | 10 | 10 | 8 |
| 40 | 35 | 15 | 20 |
| 20 | 22 | 15 | 20 |
As the BLS uses Laspeyres index formula, we will put the PPI (Laspeyres) formula for accurate inflation indication.
PPI (Laspeyres) in 2020 = (∑q_0× p_t)/(∑q_0 × p_0 ) x 100
= (15 × 8+40 × 20+20× 20)/(15 × 10+40 × 15+20 × 15 ) × 100
= 125.7
PPI for base year (2010) = (15 ×10+40 × 15+20× 15)/(15 × 10+40 × 15+20 × 15 ) × 100
= 100
The PPI for the base year 2010 is 100, increasing to 125.7 in 2020. Thus, it shows that prices have risen from 100 to 127.5 in a span of 10 years.
Importance
Producer Price Index, undoubtedly, helps assess the rate of inflation. Besides that, some of the effective uses of PPI are:
- Used as a contract adjustment tool to put relevant adjustment clauses to long-term contracts, considering the percentage of price changes
- Best parameter to compare the input and output price difference
- Indicator of inflation at the producers’ levels
- A measure of inflation for particular industries or commodities
- Helps measure the real growth of an economy recorded as the Gross Domestic Product (GDP) and distinguish it from the nominal growth
Frequently Asked Questions (FAQs)
What is a Producer Price Index?
Producer Price Index (PPI) tracks the fluctuations in prices of goods and services at the producer level. It reflects the changes in prices of raw materials, semi-finished products, and finished goods. Thus, it measures the rate of inflation arising at the producer or manufacturer’s end. PPI data is released by the US Bureau of Labor Statistics (BLS).
What is the difference between PPI and CPI?
PPI stands for Producer Price Index, whereas CPI is an abbreviation for Consumer Price Index. While PPI indicates the change in the price of the products and services over a period at the manufacturer level, CPI reveals the price changes at the consumer level. Both access the overall increase or decrease in product prices over time and are a reliable measure of inflation.
What are the uses of the Producer Price Index (PPI)?
PPI indicates the price changes in inputs, semi-finished and finished products over time. It helps policymakers identify price fluctuations at the producer level and take corrective measures. It also acts as a contrast adjustment tool to alter long-term contracts for price changes. In addition, PPI helps deflate the economic data like the gross domestic product to reflect the real growth of an economy.
Recommended Articles
This has been a guide to What is Producer Price Index (PPI) & its definition. We discuss Producer Price Index as a gauge of inflation, its formula & example. You can learn more from the following articles –