Part of our Financial Functions in Excel guide
PV Function in Excel
The PV function in Excel (or present value) is a financial function that calculates the PV function of a future sum of money or fixed cash flows at a constant interest rate. The PV function in Excel is based on the concept of the time value of money. For example, receiving ₹5,000 now is worth more than ₹5,000 earned next year because the money received now could be invested to get an additional return till next year. The PV function in Excel is commonly used to compare investment alternatives, as in stock valuation, bond pricing, financial modeling, insurance, banking, pension plans, etc.
For an investment to be made today, investors calculate the PV in Excel of expected cash flows to decide upon the investment. Suppose you have an amount of ₹10,00,000 today to invest, and you have two alternate plans, which are expected to give you:
- ₹30,000 monthly for the next 5 years (which is ₹18,00,000 in total).
- ₹25,000 quarterly for the next 20 years (which is ₹25,00,000 in total).
Both investment plans seem to be giving a good profit of ₹25,00,000 (case 2) is more than ₹18,00,000 (case 1). Both are more than the current investment of ₹10,00,000. However, not in terms of time. In this, you would like to know the present value of these regular cash flows to decide if this investment is worth making and compare it between the two investment alternatives. By the end of this article, you will realize that plan 1 is much better than plan 2.
PV in Excel Formula
In Excel; a built-in function is available to calculate PV. The PV Excel formula is as follows:
The arguments in the PV excel formula are as follows:
| rate* | The rate of interest or return per period. Also termed as the discount rate. |
| nper* | The number of periods for the lifetime of the annuity or investment. |
| pmt | The payment is made per period. It includes both the principal amount and interest. |
| fv | It specifies the future value of the annuity at the end of nper payments. (default value: 0) |
| type | Optional. Value: 0 or 1. It defines whether the payment is made at the start or the end of the period. 0: the payment is made at the end of the period; 1: the payment is made at the start of the period. (default value : 0 denoting payments made at the end of the period). |
If pmt is omitted, we should provide the fv argument.
PV in Excel – Assumptions
There are two assumptions of PV in Excel function:
- Constant and Periodic payment
- Constant rate of interest or return
A series of cash flows that include a similar amount of cash flow (outflow or inflow) each period is called an annuity. For example, a car loan is an annuity. When each period’s interest rate is the same, an annuity can be valued using the PV function in Excel. In the case of annuity functions, a general convention of cash flow is followed- cash outflows are represented as negative, and cash inflows are expressed as positive. So, the pmt is negative if it is an outflow.
You can use PV formula Excel with i) periodic and constant payments and ii) future value. For example, if you opt for a car loan, you should pay a fixed amount of money periodically, e.g., ₹20,000 monthly for two years. In this case, you use the pmt option as ₹20,000 to calculate the present value. You can also use the PV function in excel with a fixed future value. For example, suppose you plan to attain a sum of ₹5,00,000 after 5 years of your child’s education. Then, you can calculate the PV formula in Excel using the fv option.
How to Use the PV Function in Excel?
Let us understand the working of the PV function in Excel with a few examples.
PV in Excel Function Example #1
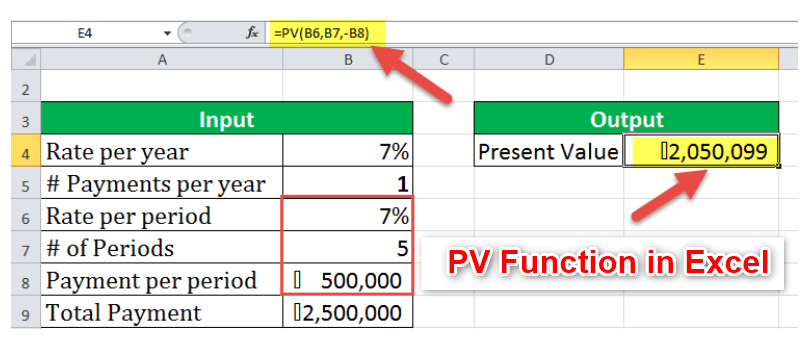
With an interest rate of 7% per annum, a payment of ₹5,00,000 is made every year for five years.
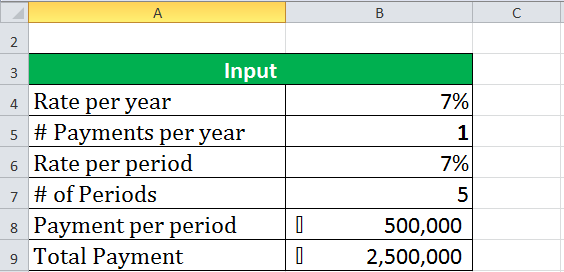
The present value of an annuity can be calculated using the PV function in Excel as PV(7%, 5, -500000), as shown in the example below.
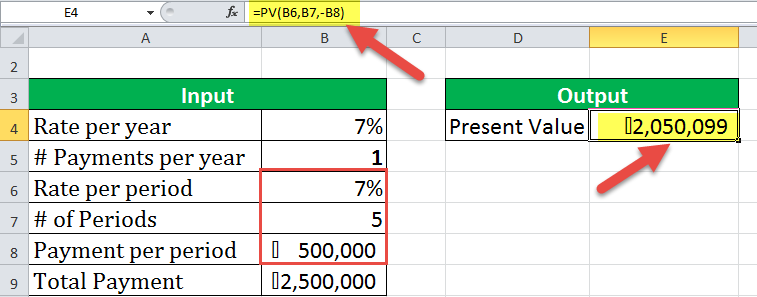
The present value in the above case is ₹20,50,099.
In this case, the interest rate is the rate per period, which is different from the rate per annum used commonly.
PV in Excel Function Example #2
Suppose you make quarterly payments of ₹1,25,000 per period for five years, having an interest rate per annum of 7%. The interest rate per period will be counted as 7%*4/12 quarterly.
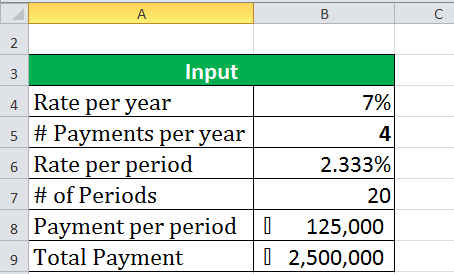
It will give the PV function Excel as (rate=7%*4/12, nper=4*5, pmt=-125000).
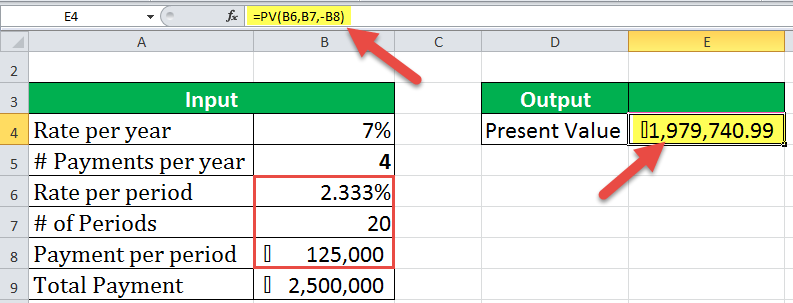
PV in Excel Function Example #3
Suppose you have a future value goal of ₹25,00,000 to attain from an investment in 20 periods having an interest rate of 2.333%. If the payment is made at the end of each period, the present value can be calculated in such cases using this function as PV(rate=2.333%, nper=20, fv=2500000, type=0).
PV in Excel Example #4
Going back to the previous case, you need to compare two alternative investment plans:
- ₹30,000 monthly for the next 5 years (which is ₹18,00,000 in total).
- ₹25,000 quarterly for the next 20 years (which is ₹25,00,000 in total)
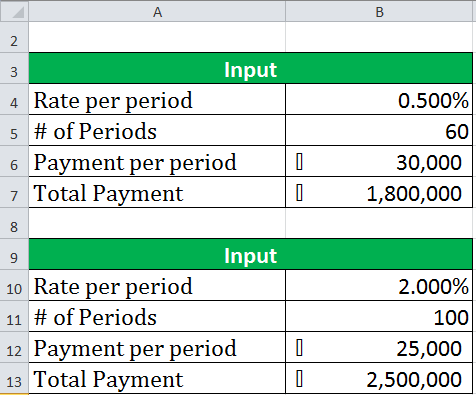
Assuming a rate of 6% per annum, the rate per period (1) 6%/12 = 0.5%, (2) 6%*4/12 = 2%.
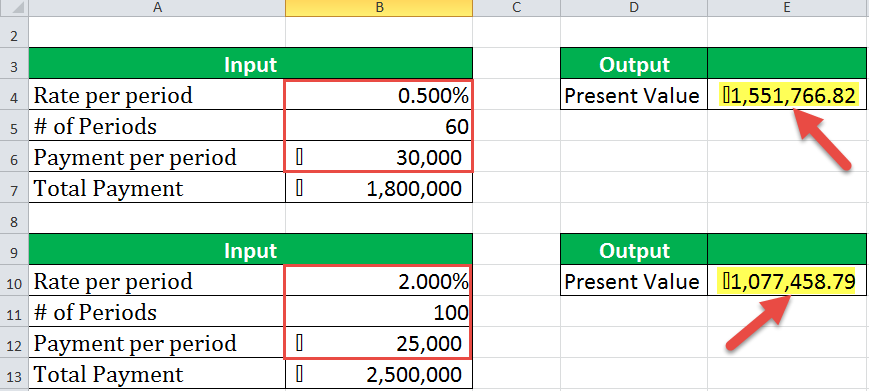
You get the present value of (1) ₹15,51,767 (2) ₹10,77,459.
So, you would like to choose the first plan as the present value from the first plan is much larger than the second.
Things to Remember About The PV Function in Excel
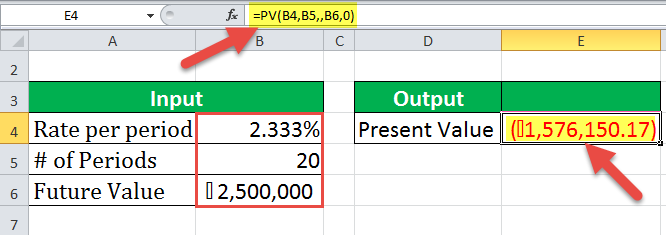
- The PV function in Excel uses a specific order of values (the rate, nper, pmt, fv, type) and is separated by “,” If any of the arguments are not provided, pv in Excel function can be left blank. As in example 3, it is PV(B4,B5,,B6,0).
- The rate is the interest/return rate per period, which is different from the annual rate.
- The PV Excel function allows cash flows either at the beginning or end of the period.
- There is constant cash flow and a constant interest rate in the PV Excel function.
Recommended Articles
This article is a guide to PV Function in Excel. We discuss the PV formula in Excel and how to use PV in Excel, along with practical examples and downloadable Excel templates: –