Excel Break-Even Point
Break-Even Point (BEP) in Excel is the first landmark every business wants to achieve to sustain itself in the market. So, even when you work for other companies as an Analyst, they may want you to find the Excel break-even point of business.
Now, we will see what precisely the break-even point is meant for. For example, your monthly expenditure is 15,000, including all the rental, communications, food, beverages, etc. But, on the other hand, your per day salary is 1,000. So, when you earn 15,000, it becomes a break-even point for you. Anything made after the break-even point will be considered a profit.
So in business terms, if the amount of profit and expenses are equal, that is called the break-even point. So in simple terms, the break-even point is where a project’s cash inflow should equal the project’s cash outflow.
The cost could come in multiple ways, and we classify that into Fixed Cost, Variable Cost, and other miscellaneous costs. Now, we will see some real-time examples of finding the break-even point in Excel analysis.

How to Calculate Break-Even Points in Excel?
Example #1
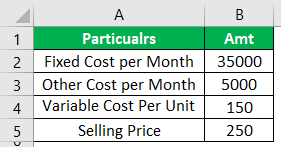
Ms. Sujit has undertaken a project of producing two-wheeler tires for two years. She has to spend ₹150 for each tire to make one tire. Her fixed cost per month is around ₹35,000, and another miscellaneous cost is ₹5,000 per month. She wants to sell each tire at ₹250 per tire.
Now, she wants to know what should be per month’s production to achieve the break-even point for her business.
We need to enter all these details given above into the worksheet area from this information. Below, we have listed the same.
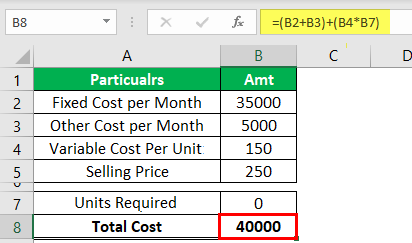
To find the break-even point, Ms. Suji must put in some formula to find the total cost.
Step 1: We should enter the formula as Total Cost = (Fixed + Other) + (Variable * Units).as Total Cost = (Fixed + Other) + (Variable * Units).
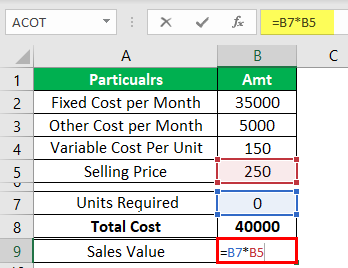
Step 2: To find the sales value, we must enter one more formula, i.e., Units * Sale Value.
Step 3: Now, enter the formula for BEP, i.e., Sale Value – Total Cost.
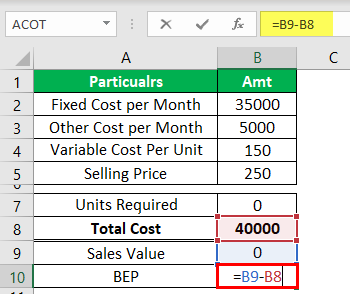
We need to find the number of tires Ms. Suji wants to produce to zero the break-even point value.
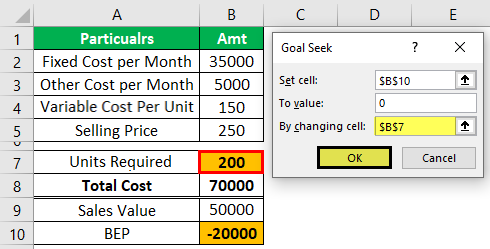
Step 4: We can find this by manually entering numbers in the “Units Required” cell. For example, now we will enter the value as 200 and see what the BEP is.
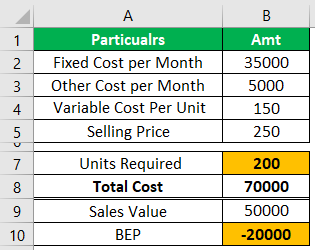
We got a break-even point of -20,000. Suppose we keep entering until we get the break-even point amount as 0. It will take a lot of time. But, we can use the “Goal Seek” tool to identify the number of units required to achieve the break-even point.
- Next, we will open the Goal Seek tool from the DATA tab.
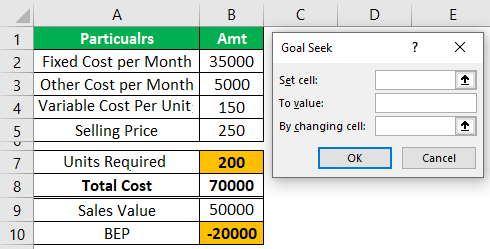
- For the first option of Goal Seek (Set cell), choose the cell BEP cell i.e., B10.
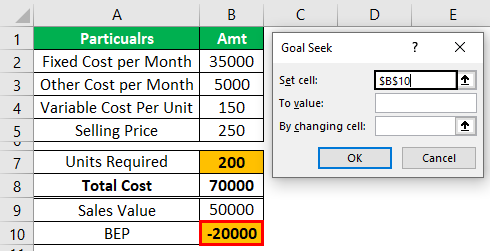
- The second option of “Goal Seek” is “To value.” We must enter zero because the “Set cell“(BEP cell) value should equal zero, which is our goal.
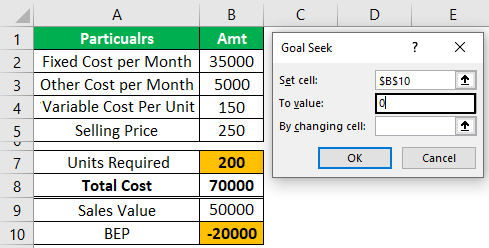
The final option is “By changing cell,”i.e., by changing the cell, we want to make the BEP cell (Set cell) value zero (To value).
- So, by finding the “Units Required” cell, we need to achieve the goal of BEP = 0, so we select cell B7.
- Now, click on “OK.” As a result, “Goal Seek” will calculate to set the Excel break-even point cell to zero.
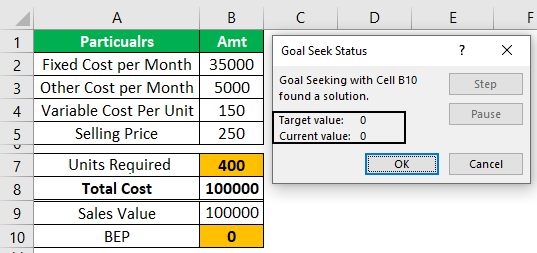
“Goal Seek” has found the “Units Required” to get the “BEP” as zero. So, Ms. Suji must produce 400 tires in a month to achieve the Break-Even Point.
Say thanks to “Goal Seek” Ms. Sujit!!!!
Example #2
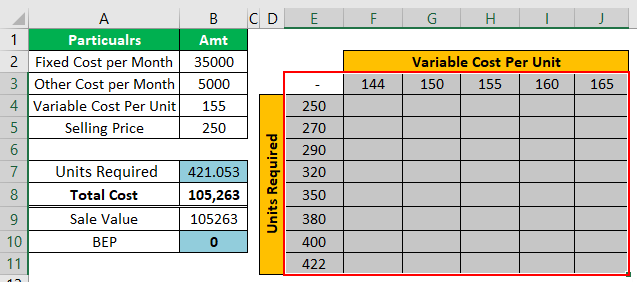
Mr. Suji must know what units are needed for the different variable costs per unit. For this, we must create a table like the one below.
- For E3 cells, give a link to the BEP cell and B10 cell.
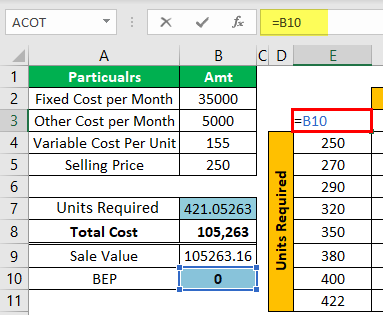
- Now, we must select the newly created table, as shown below.
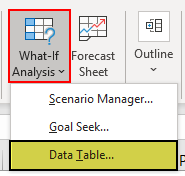
- We will go to the “DATA” tab” What-If-Analysis in excel >>> Data Table.
- Now, we can see the below option.
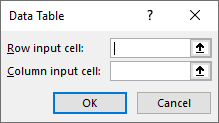
- For the “Row input cell,” we must choose the ” Variable Cost Per Unit cell i.e., B4 cell.
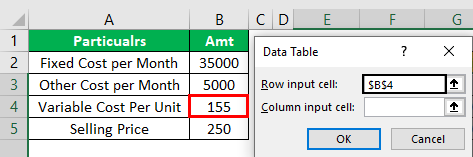
We have selected the B4 cell because we have put different “Variable Cost Per Unit” row-wise in the newly created table. Accordingly, we have chosen the “Variable Cost Per Unit” as the “Row input cell.”
- For the “Column input cell,” we must choose the “Units Required” cell because unit data are shown in columns in the newly created table.
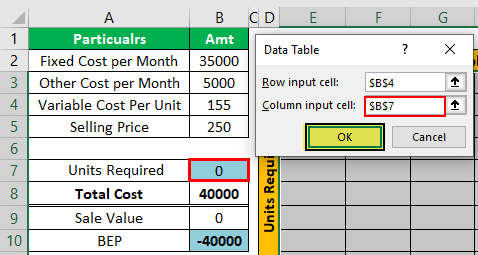
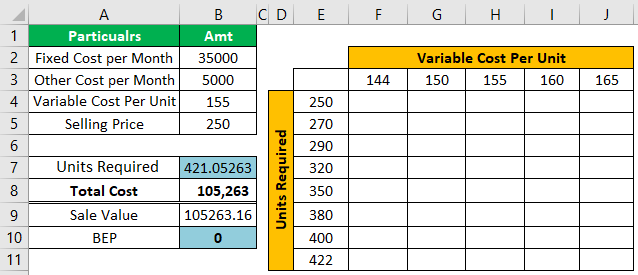
- Click on Ok; we may get the data table in Excel like the below one.
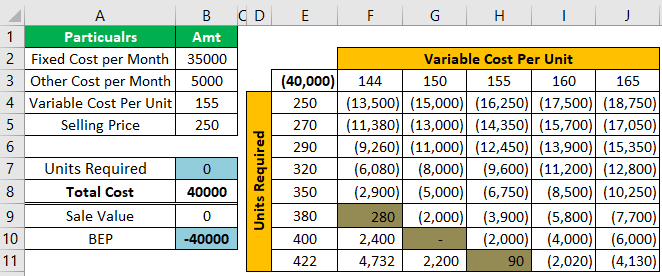
So, now we will look at the green-colored cells in the table. For example, if the variable cost per unit is 144, Ms. Suji must produce 380 tires monthly. Similarly, if the price is 150, she must make 400 tires. Finally, if the cost price is 155, then she must produce 422 tires in a month to achieve BEP.
Things to Remember
- BEP is a position of no profit and no loss.
- You need to consider all sorts of costs before calculating the break-even point in Excel.
- The moment cost and revenue are equal and are considered as BEP.
Recommended Articles
This article is a guide to Break-Even Point in Excel. Here, we discuss how to calculate break-even point in Excel, examples, and a downloadable Excel template. You may also look at these useful functions in Excel: –