
Table Of Contents
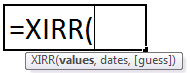
XIRR Excel Function
The XIRR function is also Excel's extended internal rate of return function. This function is calculated based on multiple investments done in the same period. It is also a financial function in Excel and a built-in function that takes values, dates, and guesses values as inputs.
For example, suppose the first investment example returns an internal rate of return in cell C10. The cash flow values are found in the range A1:A4 with the dates in B1:B4.
Assume that you have an initial investment of ₹7,500 on 1/1/2020. You then have the following income: ₹3,000 on 2/2/2021, ₹5,000 on 4/15/2021, ₹1,200 on 9/1/2021, and ₹4,000 on 10/3/2021.
=XIRR(B1:B4,A1:A4)
= 2.66.
Syntax
- value*: The transaction amounts. It refers to a series of cash flows corresponding to a payment schedule.
- dates*: The transaction dates. It refers to a series of dates corresponding to its respective transaction
- estimated_irr: Optional. The approximate return. Default=10%.
How to Use The XIRR Function in Excel
Let us take a few XIRR calculations in Excel examples before using the XIRR excel function workbook:
Example #1
Suppose you invest ₹8,000 in Mar 2012. You receive an amount of ₹2,000 at different time intervals from March to December 2017. Your input in the Excel sheet would contain the time and corresponding amount, as shown below.
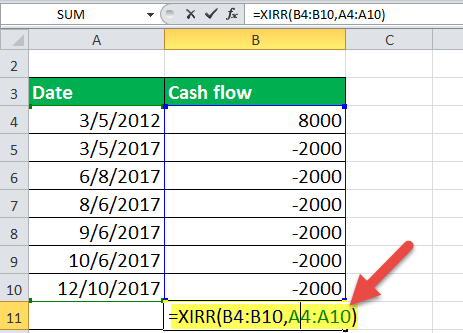
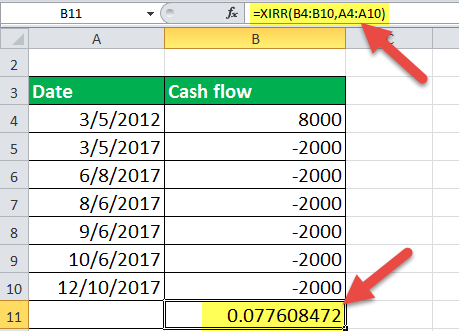
The XIRR Excel can thus be calculated as XIRR(values, dates), as shown below.
Example #2
Suppose you invest ₹2,000 multiple times from 1 April 2017 to 10 Dec 2017. In the end, you receive an amount of ₹20,000 on 5 March 2018. In this case, your input in the Excel sheet should be like this:
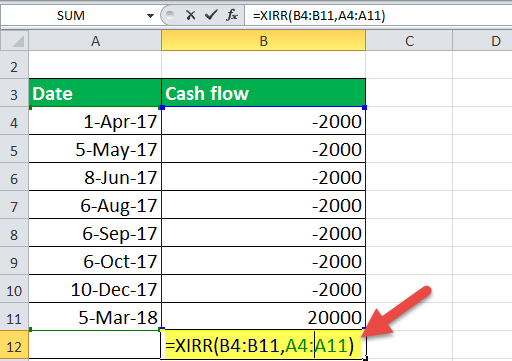
To calculate the rate of return on this investment, you will provide the input as XIRR(values, dates), as shown below.
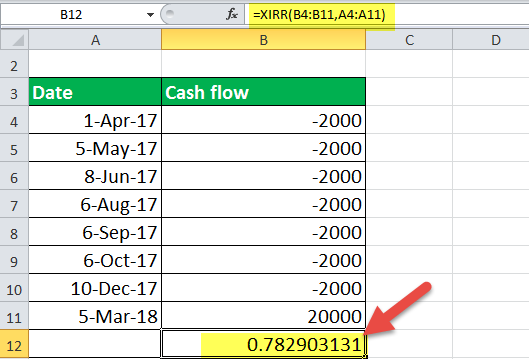
You will find that the XIRR in the above case is 0.78.
Example #3
Let us assume that you invested an amount of ₹8,000 in March 2011 in mutual funds. After seeing good returns on your amount, you invested every year with a 10% increase each time. In the 8th year, you received an amount of ₹100,000. The input, in this case, will be as shown below:
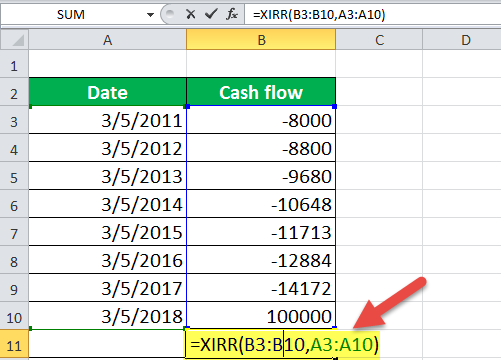
The XIRR will be calculated as XIRR(values, dates) à XIRR(B3: B10, A3: A10).
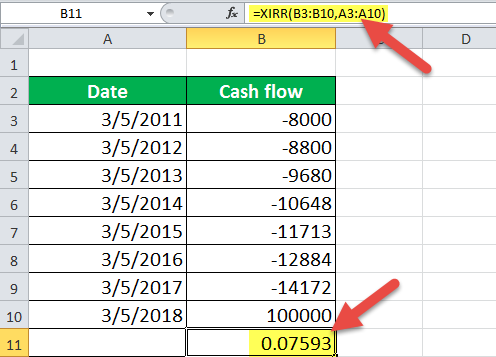
We can also consider the above example differently. On your first investment, you receive a total amount of ₹8,800 (10% on your investment) in a year. So, you decide to invest this amount, which gives you a return of 10% again. This cycle goes on for consecutive 7 years, and you receive an amount of ₹1,00,000 in the 8th year.
Example #4
Suppose you invest ₹8,000 in three consecutive years and receive a total of ₹28,000 in the next five years. In this case, both the investments and the redemptions are made over some time. Therefore, the input in Excel will be as shown below:
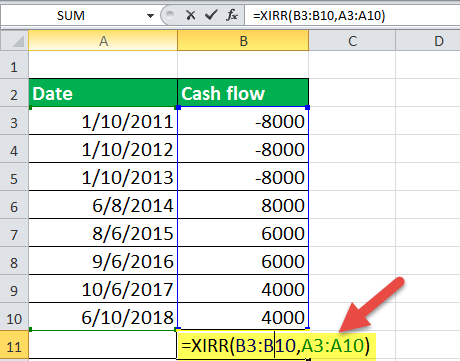
For calculating the rate of return on this transaction, the XIRR function will be given by XIRR(values, dates) as shown below:
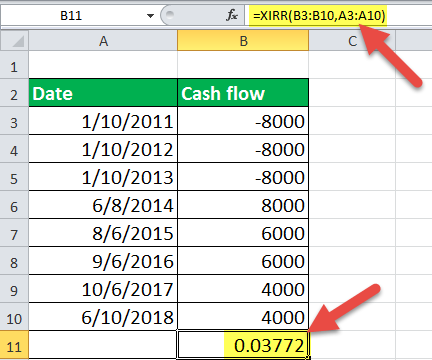
The XIRR here is 0.037.
Applications
The XIRR in Excel applies to any investment portfolio with multiple cash flows over time. Some include Mutual fund SIP, money back plans, PPF, EPF, etc. Sometimes you may want to see your returns on your investments in the share market over the last 10 years. We can also use the XIRR Excel to combine several investments made at different places to calculate the overall rate of return.
Things to Remember
- The amount invested (outflow) should be counted as negative and the amount received (inflow) as positive.
- The cash flow values can be listed in any order.
- There should be cash outflow and inflow. If either is missing, the XIRR function will return the #NUM! Error.
- The dates should be valid. Providing an invalid date in the date parameter will result in #NUM! Error in the XIRR function.
- The number of values and dates should be equal. Unequal numbers will result in an error.
