Formula to Calculate Sampling Error
The sampling error formula one may use to calculate statistical error when the person conducting the test doesn’t select the sample representing the whole population under consideration. As per the formula, sampling error is calculated by dividing the population’s standard deviation by the square root of the sample size and then multiplying the resultant with the Z-score value based on the confidence interval.
Sampling Error = Z x (σ /√n)
Where,
- Z is the Z score value based on the confidence interval
- σ is the population standard deviation
- n is the size of the sample
Key Takeaways
- The sampling error formula determines statistical error if the person performing the test does not choose the sample presenting the whole population under consideration.
- One may calculate the sampling error by dividing the population’s standard deviation by the square root of the sample size and then multiplying the resultant with the Z-score value depending on the confidence interval.
- It is essential to know the concept as it may show how much one may expect the survey results to depict the overall population view.
- One must remember that a survey utilizes a smaller population called the sample size, also called the survey respondents, to represent an enormous population
Step by Step Calculation of Sampling Error
The following are the steps to calculate sampling error.
- Gathered all sets of data called the population. Compute the population means and population standard deviation.
- Now, one needs to determine the sample size. Further, the sample size has to be less than the population and should not be greater.
- Determine the confidence level. Accordingly, one can determine the value of the Z-score from its table.
- Now, multiply the Z-score by the population standard deviation and divide the same by the square root of the sample size to arrive at a margin of error orsample sizeerror.
Examples
Example #1
Suppose the population standard deviation is 0.30 and the sample size is 100. What will the sampling error be at a 95% confidence level?
Solution
Here, we have given the population standard deviation as well as the size of the sample. Therefore, we can use the below formula to calculate the same.
Use the following data for the calculation.
- Z Factor Value: 1.96
- The population of standard deviation: 0.3
- Sample Size: 100
Therefore, the calculation of the sampling error is as follows,

Sampling Error will be –

Example #2
Gautam is currently pursuing an accountancy course and has cleared his entrance exam. He has registered now for an intermediate level and will also join a senior accountant as an intern. In addition, he will be working on an audit of the manufacturing firms.
One of the firms he was visiting for the first time asked to check whether the bills for all the purchase entries were reasonably available. The sample size he picked was 50, and the population standard deviation for the same was 0.50.
Based on available information, you must calculate sampling error at 95% and 99% confidence intervals.
Solution
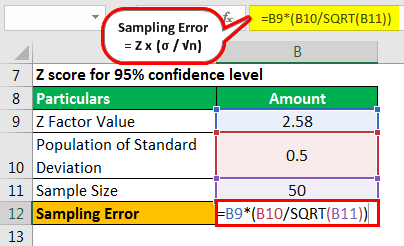
Here we are given the population standard deviation as well as the size of the sample; therefore, we can use the below formula to calculate the same.
Z-score for a 95% confidence level will be 1.96 (available from the Z-score table)
Use the following data for the calculation.
- Z Factor Value: 1.96
- The population of standard deviation: 0.50
- Sample Size: 50
Therefore, the calculation is as follows,

Sampling Error will be –

Z score for 95% confidence level will be 2.58 (available from Z score table)
Use the following data for the calculation.

Therefore, the calculation is as follows,
Sampling Error will be –

As the confidence level increases, the sampling error also increases.
Example #3
In a school, a biometric session was organized to check the students’ health. They initiated the session with students of class X standard. In total, there are 30 students in the B division. Among them, 12 students were selected randomly for a detailed checkup, and the rest were only basic tests. The report inferred that the average height of the students in the B division is 154.

Solution
The population standard deviation was 9.39. You must calculate a 90% and 95% confidence interval sampling error based on the above information.
Here, we have the population standard deviation as well as the size of the sample. Therefore, we can use the below formula to compute the same.
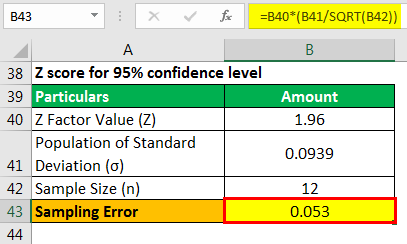
The 95% confidence level Z-score will be 1.96 (available from the Z-score table).
Use the following data for the calculation.

Therefore, the calculation of the sampling error is as follows,

Sampling Error will be –
Z score for 90% confidence level will be 1.645 (available from Z score table)
Use the following data for the calculation.

Therefore, the calculation is as follows,
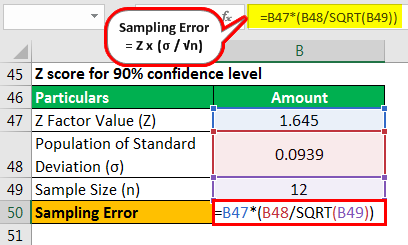
Sampling Error will be –
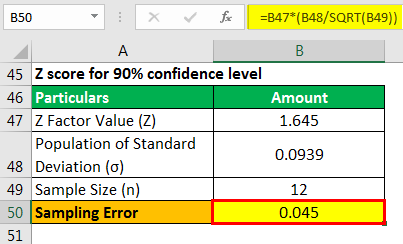
As the confidence level decreases, the sampling error also decreases.
Relevance and Uses
It is vital to understand this concept as it shall depict how much one can expect the survey results to depict the overall view of the population. One needs to remember a survey uses a smaller population called the sample size (also known as the survey respondents) to represent a bigger population.
One can view it as a way of calculating the effectiveness of the survey. When the sampling margin is higher, it shall represent that the survey consequences might stray from the actual total population representation. On the flip side, a sampling error or margin of error that is smaller than that shall indicate that the consequences are now closer to the true representation of the population in total and which shall build a higher level of confidence about the survey under view.
Frequently Asked Questions (FAQs)
Can sampling error be negative?
In the sampling error formula, the sampling errors can be positive or negative.
How does the sampling error formula relate to sampling distributions?
The sampling distributions show sampling error and precision utilizing the width of the curves. In addition, the tighter distributions show lower error and more accurate estimates since they cluster more tightly around the population value.
Can the sampling error formula be eliminated?
One can eliminate the errors by increasing the sample size or number.
Is the sampling error formula the same as the standard error?
In the sampling error formula, the most commonly used tool to determine the sampling error is the standard error (SE).
Recommended Articles
This article has been a guide to the Sampling Error Formula. Here, we discuss the formula to calculate the sampling error along with examples and a downloadable Excel template. You can learn more about accounting from the following articles: –