Stratified Sampling Definition
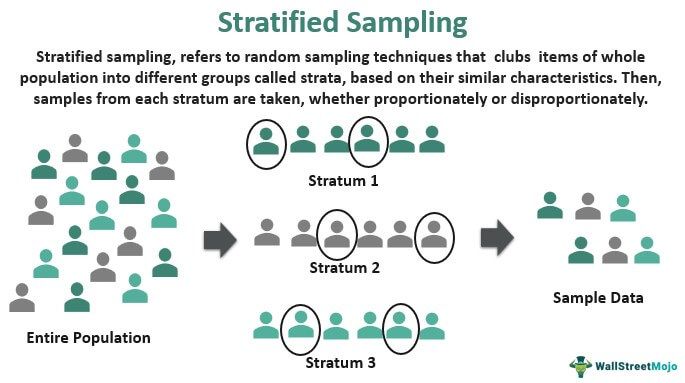
Stratified sampling is a random sampling method of dividing the population into various subgroups or strata and drawing a random sample from each. Each subgroup or stratum consists of items that have common characteristics. This sampling method is widely used in human research or political surveys.
It is different from simple random sampling that directly takes any part of the entire population as a sample. Moreover, it is a reliable technique since the items exhibiting different features are equally selected to form a sample that mirrors the whole population. Thus, such a sample is a better representative of the overall population.
Key Takeaways
- Stratified sampling is a process whereby the heterogeneous population is segregated into various homogenous subgroups or strata, and a sample is extracted from each.
- A “stratum” is nothing but a group; it is plurally written as strata. Thus, stratification is the process of grouping items or data.
- Stratified sampling can be proportionate or disproportionate. When the samples are taken in the same percentage or ratio from each subgroup, it is known as proportionate stratified random sampling.
- When samples are picked up in no prescribed ratio or rate, it is referred to as disproportionate stratified random sampling.
- The stratified sample is more reflective of the whole population as each subgroup is adequately represented in the sample.
How Stratified Sampling Method Works?
The term stratified emerged from the word “strata,” which refers to groups. Thus, stratified random sampling emphasizes distributing the assorted data into multiple groups. Each group has variables of similar attributes. A sample or data set is selected from each of these groups for analysis.
Please note that each stratum must be mutually exclusive and exhaustive. In other words, an element or item included in one stratum cannot be added to any other stratum. Duplication of data in multiple strata may lead to unreliable results.
The primary purpose of this technique is to ensure that the total sample is a blend of all the different kinds of items in the population. This mix guarantees that the whole population is closely replicated in the sample.
Let’s assume a research team is surveying an FMCG company about the taste and preferences of people in food choices. The team decided to take three significant categories: men, women, and children. The total number of persons required for the data set is close to one million in numbers.
How could stratified random sampling help researchers gather the data needed using less time and resources? It isn’t easy to talk to one million people and take their opinion. However, it’s much more convenient and time-saving to create three groups and select a few amongst them, say 10% people from each group.
The selected individuals will represent their group in the sample. Their opinion will be similar to most of the individuals in their group. Thus, sampling through data segregation will ensure each category or group is sufficiently represented in the sample. Therefore, the survey results will speak for the whole population.
This sampling method has been a standard probability sampling technique used by portfolio managers to design portfolios for their clients. It provides the desired returns by replicating different indexes like the stocks index or the bonds index.
Also, it is a prominent practice in auditing and vouching. Even an auditor, generally Certified Public Accountant (CPA), uses this formula at large for vouching and verification purposes in auditing the company’s accounts. This formula fits well for their criteria as auditors can create various groups or subgroups based on the amounts involved. This practice helps reduce the sample size without compromising on the reliability of the sample collected.
Types of Stratified Sampling
There are two fundamental ways of executing this sampling technique. These are as follows:
#1 – Proportionate:
Here, the same percentage of items is selected from each stratum. The sample size of each stratum is proportional to its population. The total of the samples from all groups forms the total sample size of the whole population.
For example, suppose the population of a town has to be divided into three categories based on their age.
| Category | Age Limit | Population |
|---|---|---|
| A | Below 18 years | 4100 |
| B | 18 – 44 years | 3500 |
| C | 44 years above | 2400 |
| Total | 10000 |
If the sample size is 2000, we can determine the number of samples taken from each group using proportionate sampling.
Proportion of sample size to population = 2000/10000*1000 = 20%
| Category | Population | Sample |
|---|---|---|
| A | 4100 | 20% of 4100 = 820 |
| B | 3500 | 20% of 3500 = 700 |
| C | 2400 | 20% of 2400 = 480 |
| Total | 10000 | 20% of 10000 = 2000 |
Sample size = 820 + 700 + 480 = 2000
In the above illustration, we observe that 20% of sample items are selected from each category. Also, the cumulative number of samples taken from all the subgroups combine to form 20% of the total sample size.
#2 – Disproportionate:
Here, the size of each stratum is not proportional to its population size. The researcher doesn’t take the samples in the same ratio from each group under this random sampling technique. Thus, the sample selection may not be equitable in this case. For instance, the researcher can select the same number of items from each stratum irrespective of the group size.
Going by the above example, suppose the sample size remains 2000 people. Then, using the disproportionate method, the researcher selects 600 people from category A and C and 800 people from category B.
| Category | Population | Sample |
|---|---|---|
| A | 4100 | 600 |
| B | 3500 | 800 |
| C | 2400 | 600 |
| Total | 10000 | 2000 |
So here, the researcher has picked samples regardless of the population size of each stratum. Thus, even though category A has the maximum population size and category C has the lowest population size, their sample size is the same.
Stratified Sampling Formula
There is no particular formula for this sampling since the decisions like division of sub-groups or strata and the total sample size to reflect the entire population are at the discretion of the researcher.
But the following formula can be used to find out the sample size for each subgroup under the proportionate sampling:
Stratified Sampling Example
A business research team has to survey 120,000 employees working in different U.S. locations of a company. The number of employees employed in various branches of the company is as follows:
| Branch Office | Number of Employees |
|---|---|
| Washington | 20,000 |
| New York | 26,000 |
| New Jersey | 19,000 |
| California | 38,000 |
| Kansas | 17,000 |
| Total | 120,000 |
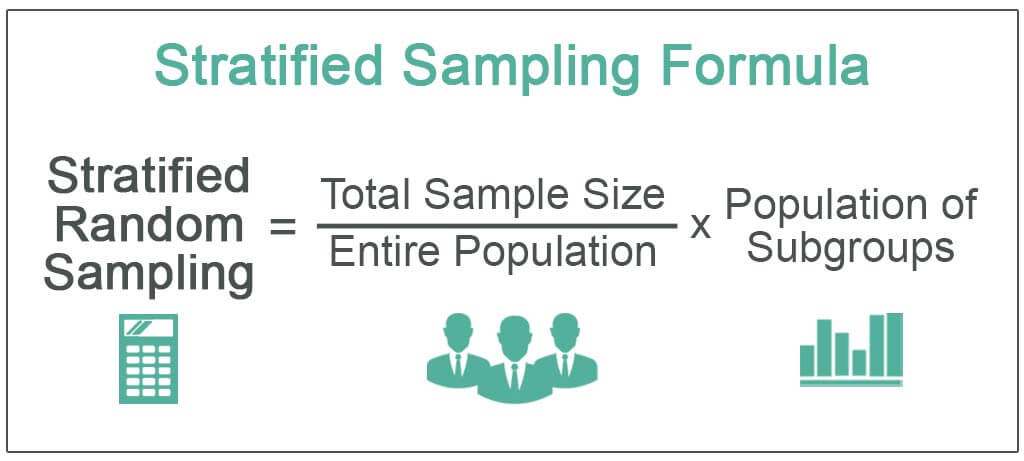
If the total sample size is 12,000, the team can determine the samples from each stratum or sub-group using the following formula.
Stratified Sampling = Total Sample Size / Entire Population * Population of Subgroups
Calculation of the sample size for the Washington office:
- Number of Samples = (12,000/120,000) *20,000
- Sample Size of Washington Office = 2,000
Similarly, we can find the sample size for all branch offices using the above formula.
| Branch Office | Sample Size |
|---|---|
| Washington | 2,000 |
| New York | 2,600 |
| New Jersey | 1,900 |
| California | 3,800 |
| Kansas | 1,700 |
| Total | 12,000 |
Real-life Example
A research paper published in medRxiv discusses the suitability of using the stratified random sampling technique for estimating COVID-19 prevalence in the U.S. state of Maryland. In this survey, the population of Maryland was stratified or divided based on counties. Then, individuals were selected from each county representing their stratum.
As per the study, the stratified sampling technique for testing COVID-19 prevalence is acceptable. But the sample arrived through stratification must be adjusted for misclassification error to avoid under-or overestimation of COVID cases.
Advantages
This sampling technique is a highly effective technique for the following reasons:
- Replicates Heterogeneous Population: It is efficient to select a sample of varying characteristics by creating subgroups. Thus, the samples from each subgroup or stratum effectively represent the entire population.
- Fair Analysis: It includes the samples with distinct data giving a reasonable weightage to each category for unbiased interpretation.
- Accurate and Reliable Results: When the samples are evenly taken from all the categories or groups with different attributes, it tends to provide efficient and meaningful outcomes.
- Saves Time and Money: Studying the whole population is tedious and leads to the wastage of resources. At the same time, this technique helps select a very proximate sample of significantly smaller size, which saves the researcher time and money.
- Facilitates Comparative Study: It clearly distinguishes the entire population into different strata by its features. Therefore, the data of each of these groups can also be compared and analyzed separately.
Disadvantages
Undoubtedly, this random sampling technique simplifies the process of research or analysis. However, it is subject to errors and inaccuracies. Let’s discuss some of the limitations that confine its applicability:
- Limited Scope: This method becomes invalid in the absence of consolidated information regarding the various attributes and mix of the population. Thus, it cannot be applied to every kind of study.
- Difficulty in Deciding Strata: Another significant problem is the formation of categories or groups. Identifying what to include or exclude and what characteristics to be considered is another challenge.
- Inapplicable to Small Population Size: When the population size is limited, say 100 people or so, there is no need for sampling. Instead, the whole population can be considered for analysis.
- Prone to Biasness: Further, this method is highly influenced by the researcher’s selection of groups, which at times may not be fair enough. Also, the mindset and abilities differ from person to person, which may affect the sampling.
Stratified Sampling vs. Cluster Sampling
Both stratified and cluster sampling are random sampling techniques. In stratified random sampling, different subgroups are formed, and each of these has items with the same attributes. After this segregation, samples are selected from each of these strata to mirror the actual population mix.
On the contrary, cluster sampling is also the process of dividing the entire population into subgroups. However, heterogeneous groups are formed where each cluster is a mix of items with different attributes. In this method, random cluster(s) are chosen and their elements form the final sample. Here, the cluster is taken as a sample as it replicates the total heterogeneous population.
In the former, the groups are called strata, while in the latter, these are termed clusters. Also, the sample in stratified sampling is the elements in the strata, whereas, in cluster sampling, a cluster or group is considered a sample. In the former, the researcher forms heterogeneous strata, each with homogenous items. However, in the latter, the researcher makes homogenous clusters with heterogeneous items.
Frequently Asked Questions (FAQs)
What is stratified sampling?
Stratified sampling refers to a random sampling technique that clubs items of the whole population into different groups based on their similar characteristics. Then, samples from each stratum are taken, whether proportionately or disproportionately, to conduct the research or analysis.
Why is stratified sampling used?
The stratified random sampling method provides sample data that is almost identical to the entire population data. Thus, the analysis turns out to be more accurate when the variables are selected from all subgroups of interest.
Is stratified sampling non-probability sampling?
No, instead, it is a probability sampling technique. Also termed stratified random sampling, this form of sampling is used in research to determine the entire population’s possible behavior efficiently.
What are the four types of probability sampling?
Given below are the four different kinds of probability sampling:
- Simple random sampling
- Stratified sampling
- Systematic sampling
- Cluster sampling
Recommended Articles
This has been a guide to stratified sampling. Here we discuss the definition & working of stratified sampling method with examples, formulas, advantages, etc. You can learn more from the following articles –