Part of our Sampling Methods guide
What is the Sampling Distribution Formula?
A sampling distribution is defined as the probability-based distribution of specific statistics. Its formula helps calculate the sample’s means, range, standard deviation, and variance.
Sampling Distribution Formula Excel Template
Download Excel TemplateFor a sample size of more than 30, the sampling distribution formula is given below –
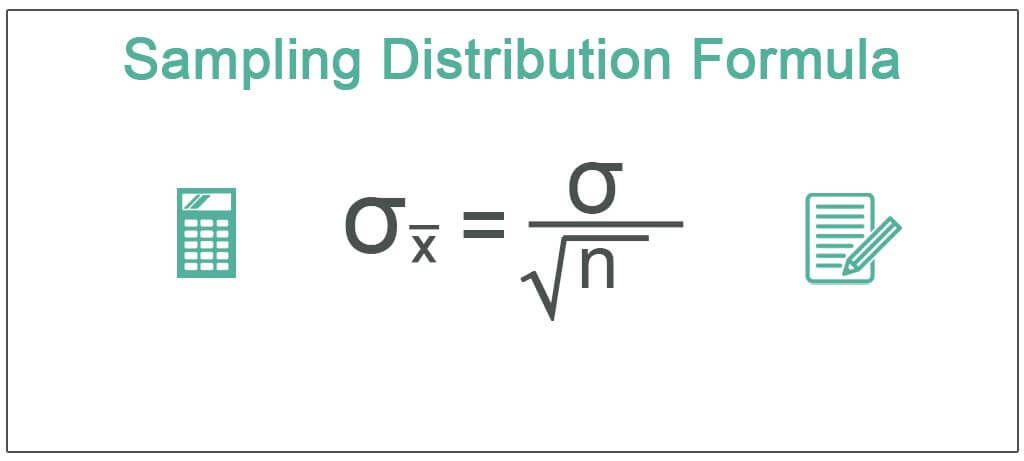
µ͞x =µ and σ͞x =σ / √n
Here,
- The mean of the sample and population represented by µ͞x and µ.
- The standard deviation of the sample and population is represented as σ͞x and σ.
- The sample size of more than 30 is represented as n.
Key Takeaways
- A sampling distribution is a probability-based specific statistics distribution. It helps to estimate the sample’s means, range, standard deviation, and variance.
- Major entities use the sampling distribution formula for research.
- It helps significantly simplify the inferences taken up in statistics. Moreover, it helps deduce analytical contemplation by determining the frequency of the samples means probability distribution.
Explanation
One can calculate the formula for Sampling Distribution by using the following steps:
Firstly, find the count of the sample having a similar size of n from the bigger population having the value of N.
Next, segregate the samples in the form of a list and determine the mean of each sample.
Next, prepare the frequency distribution of the sample mean as determined in Step 2.
- Next, determine the probability distribution of the determined sample means after determining the frequency distribution in Step 3.
Examples of Sampling Distribution Formula (with Excel Template)
Let’s see some simple to advanced practical examples of the sampling distribution equation to understand it better.
Example #1
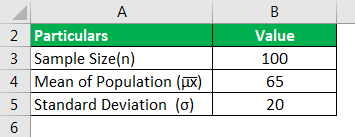
Take the example of the female population. The sample size is 100, with a mean weight of 65 kg and a standard deviation of 20 kg. Help the researcher determine the mean and standard deviation of the sample size of 100 females.
Solution
Use the below-given data for the calculation of the sampling distribution.
The sample’s mean is equivalent to the population’s mean since the sample size is more than 30.
The calculation of the standard deviation of the sample size is as follows:
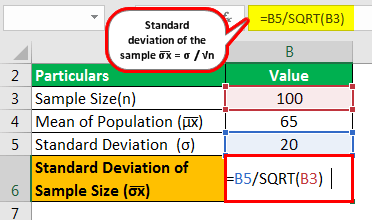
- =20/√100
The standard deviation of sample size will be:
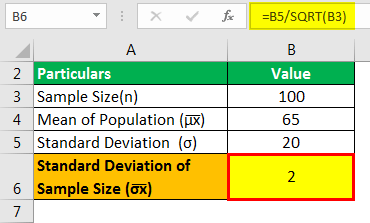
- σ͞x =2
Therefore, the standard deviation of the sample is 2, and the sample’s mean is 65 kg.
Example #2
Let us take the example of taxes paid by vehicles. In California, the average tax paid is $12,225, with a standard deviation of $5,000. They made observations on the sample size of 400 trucks and trailers combined. Help the transport department determine the sample’s mean and standard deviation.
Solution
Use the below-given data for the calculation of the sampling distribution.

The calculation of the standard deviation of the sample size is as follows:
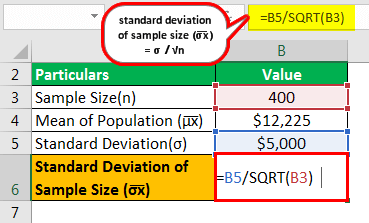
- = $5,000 / √400
The standard Deviation of the Sample Size will be –
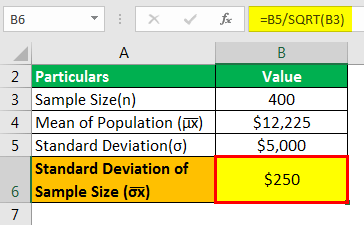
- σ͞x =$250
Therefore, the standard deviation of the sample, as assessed by the transport department, is $250, and the sample’s mean is $12,225.
Example #3
Let us take the example of the following data displayed below:
| Sample Mean | Frequency | Probability |
|---|---|---|
| 20 | 2 | 0.67 |
| 21 | 1 | 0.33 |
| 30 | 1 | 0.33 |
Help the researcher determine the mean and standard deviation of the sample.
Determine the mean of the sample as displayed below: –
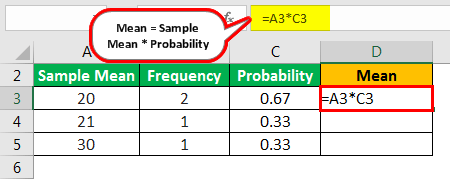
- =20*0.67
Mean will be –
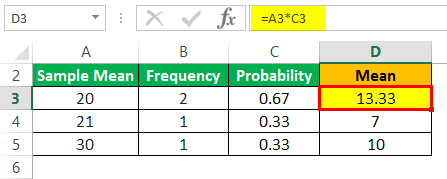
- =13.33
Total Mean
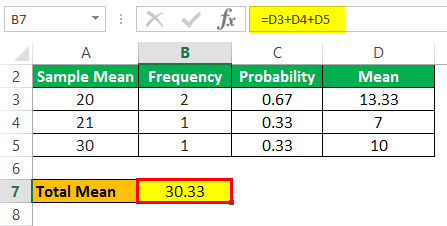
- =13.33+7+10
- Total Mean =30.33
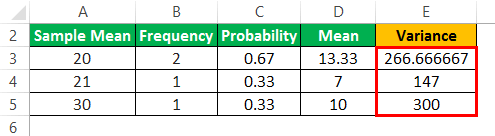
Determine the variance of the sample as displayed below: –
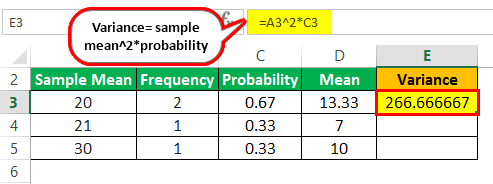
- =20^2*0.67
- =266.66667
Variance
Total Variance
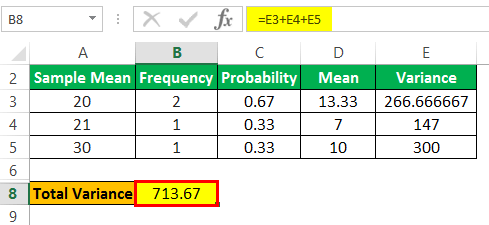
- = 713.67
The calculation of standard deviation of the sample size is as follows:

- σ͞x = √ 713.67 – 30.33
The standard Deviation will be –
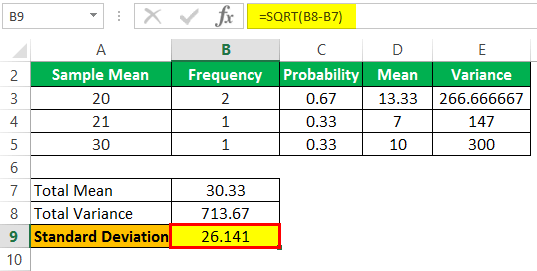
- σ͞x = 26.141
Therefore, the standard deviation of the sample assessed by the researcher is 26.141, and the sample’s mean is 30.33.
Relevance and Use
Many entities utilize the sampling distribution for research. It could be analysts, researchers, and statisticians. When the population is large, such methodology helps formulate a smaller sample, which one could then utilize to determine average means and standard deviations. The average means can be plotted on the graph to arrive at a uniform distribution relating to the population. If the researcher increases the sample size, the probability of the graph reaching normal distribution is enhanced.
It helps in the major simplification of the inferences taken up in statistics. It further helps deduce analytical contemplation by determining the frequency of the probability distribution of sample means. Finally, the sampling distribution forms the base for several statistical concepts that the researchers may use to facilitate their hypothesis.
Frequently Asked Questions (FAQs)
Why sampling distribution formula is essential?
As populations are typically large, it is essential to use a sampling distribution to choose a whole population subset. Moreover, it helps to remove variability during the finding or collection of statistical data.
How to find the sampling distribution of P-hat?
Two numbers are necessary for calculation. One is the sample size (n), while the other is the quantity (X) of the relevant event or parameter instances. P-hat = X/n represents the P-hat equation. To put it another way, one can calculate P-hat by dividing the quantity of the desired event by the sample size.
How to find the mean of the sampling distribution formula?
The sample mean is commonly distributed for samples of any size taken from a population with a customarily distributed distribution, with a mean of X and a standard deviation of X/n, where n is the sample size.
Does sample size affect the sampling distribution formula?
As the sample size increases, the sampling distribution variability reduces. Moreover, as the sample size rises, the shape sampling distribution becomes identical to a normal distribution without concerning the population shape.
Recommended Articles
This article is a guide to Sampling Distribution Formula. Here, we discuss calculating the sampling distribution of standard deviation along with practical examples and a downloadable Excel sheet. You can learn more from the following articles: –