Part of our Capital Budgeting guide
What Is Margin Of Error?
The margin of Error is a statistical expression that is used to determine the percentage point by which the result arrived will differ from the value of the entire population, and it is calculated by dividing the standard deviation of the population by the sample size and lastly multiplying the resultant with the critical factor.
A higher error indicates a high chance that the result of the sample reported may not be the true reflection of the whole population. It measures the variability or the level of uncertainty or a sampling data or a survey. It also gives an idea about the range within which the value will fall. Since it shows the deviation from the actual values, the calculation gives a confidence level about the accuracy.
Key Takeaways
- The margin of error is a statistical expression used to calculate the percentage point by which the result differs from the entire population’s value.
- It is calculated by dividing the population’s standard deviation by the sample size and multiplying the result by the critical factor.
- A higher error indicates that the sample result reported is unlikely to reflect the total population accurately.
- Understanding this concept is crucial since it indicates how well survey findings mirror the broader public’s beliefs.
- This survey uses a small group of people (survey respondents) to represent a much larger population (the target market).
Margin Of Error Explained
Margin of error refers to the method of measuring the level of uncertainty while making a survey from a sample of data. While conducting a survey from a set of sample data, it is often not possible to gather the relevant information from each and every sample due to the large volume. In such cases a small number of representative samples is taken which is used to draw the conclusion of the study.
Thus, the method explains the quantity or the extent of deviation of the sample from the actual value. It is expressed in a positive or a negative form has a confidence level in the calculation. The confidence level explains the level of probability that the true value of the population falls within the margin of error.
The confidence levels that are commonly used in the calculation include 90%, 95%, and 99%. It is important to note that a small margin of error is possible is the sample size is larger because many samples tend to provide estimates that have a higher level of accuracy. However, it also depends on the sample variability.
Formula
The formula for the margin of error is calculated by multiplying a critical factor (for a certain confidence level) with the population standard deviation. Then the result is divided by the square root of the number of observations in the sample.
Mathematically, it is represented as,
where
- z = critical factor
- ơ = population standard deviation
- n = sample size
How To Calculate?
Follow the below steps:
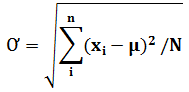
- Firstly, gather the statistical observations to form a data set called the population. Now, calculate the mean of the population. Next, compute the population standard deviation based on each observation, the population means, and the number of observations of the population, as shown below.

- Next, determine the number of observations in the sample, denoted by n. Remember that sample size is less than equal to the total population, i.e., n ≤ N.
- Next, determine the critical factor or thez-scorebased on the desired confidence level, and it is denoted by z.
- Next, finally, the margin error is calculated by multiplying the critical factor for the desired confidence level and the population standard deviation, and then the result is divided by the square root of the sample size as shown above.
Example
Let us understand the concept with the help of an example.
Let us take the example of 900 students who were part of a survey, and it was found that the average GPA of the population was 2.7, with a population standard deviation of 0.4. Calculate the margin of error for
- 90% confidence level
- 95% confidence level
- 98% confidence level
- 99% confidence level
We are going to use the following data for the calculation.

For a 90% Confidence Level
For a 90% confidence level, the critical factor or z-value is 1.645 i.e. z = 1.645
Therefore, the error at a 90% confidence level can be made using above the formula as,

- = 1.645 * 0.4 / √900
Margin Error at 90% confidence level will be-
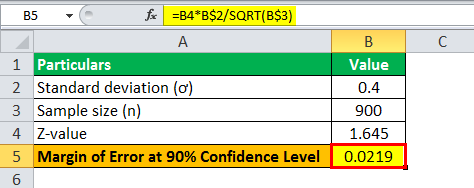
- Error = 0.0219
For a 95% Confidence Level
For a 95% confidence level, the critical factor or z-value is 1.96 i.e. z = 1.96
Therefore, the calculation of margin of error at a 95% confidence level can be done using the above the formula as,
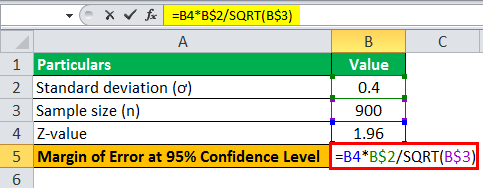
- = 1.96 * 0.4 / √900
Margin Error at 95% confidence level will be-
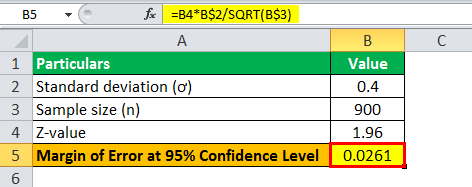
- Error = 0.0261
For a 98% confidence level
For a 98% confidence level, the critical factor or z-value is 2.33 i.e. z = 2.33
Therefore, the calculation of margin of error at a 98% confidence level can be done using the above the formula as,
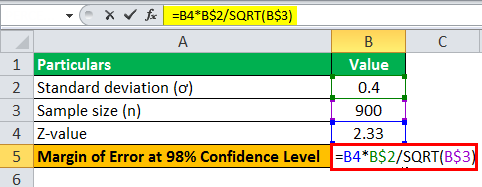
- = 2.33 * 0.4 / √900
Margin Error at 98% confidence level will be-
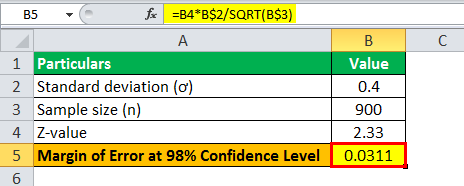
- Error = 0.0311
Therefore, the error for the sample at 98% confidence level is 0.0311.
For a 99% confidence level
For a 99% confidence level, the critical factor or z-value is 2.58 i.e. z = 2.58
Therefore, the calculation of margin at a 99% confidence level can be done using the above the formula as,
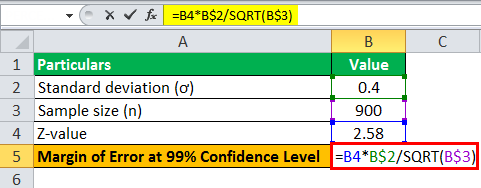
- = 2.58 * 0.4 / √900
Margin Error at 99% confidence level will be-
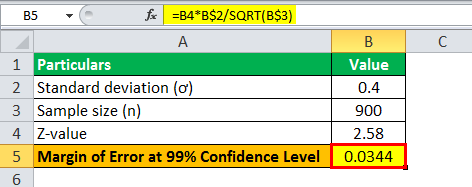
- Error = 0.0344
Consequently, it can be seen that the error of a sample increases with the increase in confidence level.
Calculator
You can use the following calculator.
Benefits
Like any other statistical concept, this concept also has some benefits and limitations. Let us understand the benefits.
The margin of error equation can be seen as a way of measuring the effectiveness of the survey. It is essential to understand this concept because it indicates how much one can expect that survey results reflect the true view of the overall population. It should be kept in mind that a survey uses a smaller group of people (also known as survey respondents) to represent a much larger population (also known as the target market.
A higher margin indicates that the survey results may stray from the actual views of the total population. On the other hand, a smaller margin indicates that the results are close to the true reflection of the total population, which builds more confidence in the survey.
Limitations
Apart from the benefits, the concept has some limitations, which are as follows:
- The formula has the assumption that the samples selected represents the entire population. However, if the samples are not authentic or accurate, then the calculation will not yield proper results.
- It follows some specific methods like stratified sampling or simple random sampling. In case the method used is different from the standard methods that are used, the process may not give the desired result.
- The calculation assumes that a normal distribution is followed. Some data sets may not have a perfectly normal distribution affecting the accuracy and authenticity of the calculation.
- The sample size is also important in this case. A large number of samples may bring the error margin down. However, a large size does not mean that it should be very large. There should be a balance between the desired result and the available resources.
- Individuals without the statistical background may find it difficult to interpret the calculation.
Margin Of Error Vs Standard Error
Both the above statistical concepts identify the uncertainty of a situation in a sample data set. However, the difference between them are as follows.
- The former is associated with sampling data and signifies a range whereas the latter signifies the dispersion of statistics around the true population mean.
- The former provides a conclusion about the population whereas the latter gives an estimate of the precision of sample data.
- The former is expressed as a range of positive or negative value whereas but the latter is not.
Frequently Asked Questions (FAQs)
Frequently Asked Questions
Are the margin of error and standard error the same?
<p>The margin of error in a confidence interval is the amount added and taken off. If we could collect numerous samples of the same size, the standard error would be the standard deviation of the sample statistics.</p>
What reduces the margin of error?
<p>The margin of error diminishes as the sample size grows. The margin of error grows as population variability increases. As the degree of confidence rises, so does the margin of error.</p>
What happens if the margin of error is too high?
<p>A statistical measure known as the margin of error describes how much random sampling error there is in survey results. One should be less confident that a poll’s findings correctly mirror those of a population census the higher the margin of error.</p>
Recommended Articles
This has been a guide to the Margin of Error and its definition. Here we learn how to calculate the Margin of Error using its formula along with practical examples and a downloadable excel template. You can learn more about financial analysis from the following articles –