Part of our Profitability Ratios guide
Differences Between Basic EPS and Diluted EPS
One may use basic and diluted EPS to determine a company’s profitability. For example, one may calculate the basic EPS by considering the outstanding common shares. However, diluted earnings per share include not just common shares but also convertible securities such as options, warrants, and convertible debt.
Basic EPS measures how much a business earns per share without any other detail. By dividing the (net income – preferred dividend) by the number of outstanding equity shares, we could calculate basic EPS.
Diluted EPS takes convertible securities into account to calculate earnings per share. Convertible securities include convertible preferred shares, employee stock options, debt, equity, etc.
In layman’s terms, the basic difference between basic EPS and diluted EPS is that diluted EPS assumes that all the convertible securities will exercise.
In this article, we will go through each metric and try to make a comparative analysis between them.
Basic Explanation of EPS in Vedio

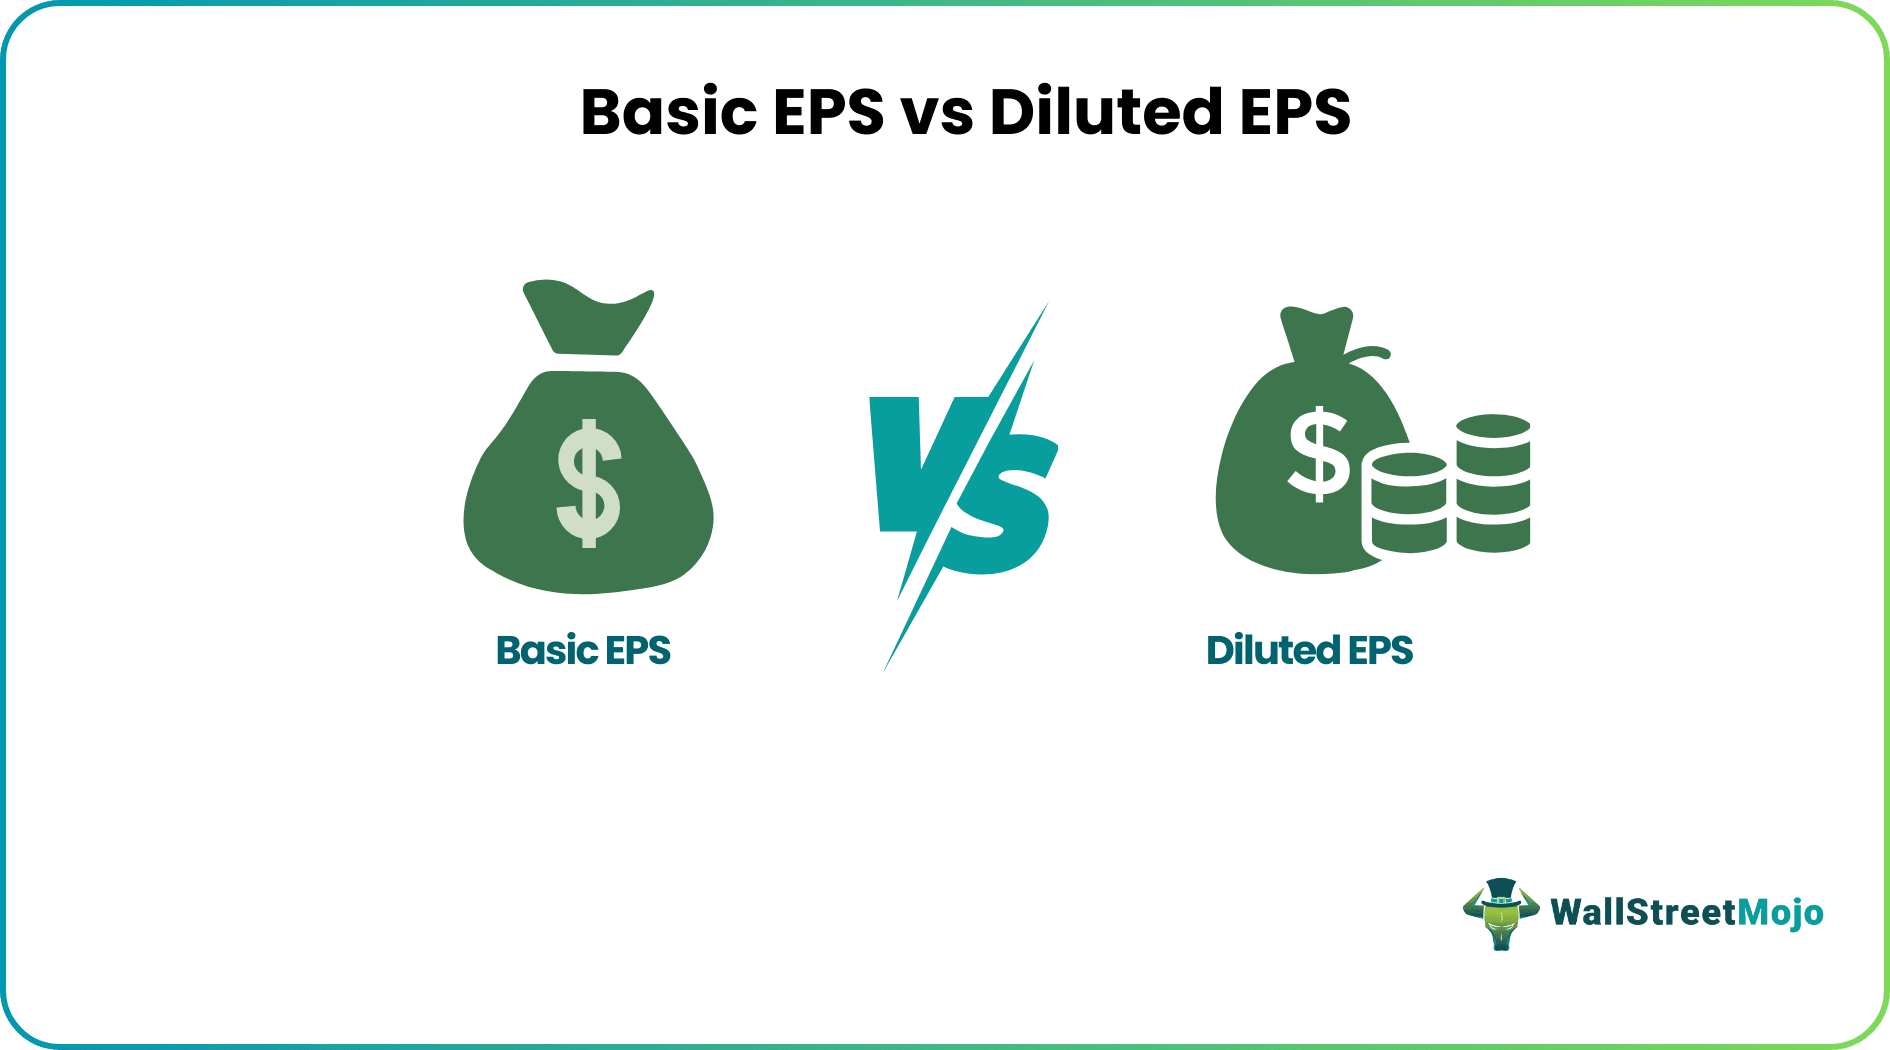
Basic EPS vs. Diluted EPS Infographics

Key Differences
- Basic EPS is a simple measure of profitability. Diluted EPS, on the other hand, is a complex measure.
- Basic EPS is the most suitable but not very sound approach to finding out how a company is doing financially. Diluted EPS is a much better and strictest approach to determine how a company is doing financially.
- One can calculate basic EPS by deducting the preferred dividend from the net income and dividing it by the outstanding equity shares. On the other hand, one can calculate diluted EPS by adding net income, convertible preferred dividends, and debt interest and then dividing the sum by outstanding shares plus all convertible securities of the company.
- The basic EPS is useful for companies that have a simple capital structure. And, diluted EPS for companies that have complex capital structures.
- Basic EPS is always higher than diluted EPS since, in diluted EPS, all convertible securities add to the common shares in the denominator.
Comparative Table
| Basis for Comparison | Basic EPS | Diluted EPS |
|---|---|---|
| Inherent meaning | Help find out the company’s basic earnings per equity share. | Help find out the earnings of the company per convertible share. |
| Purpose | To find out the profitability of a company. | To find out the profitability of a company by including convertible securities. |
| Significance to Investors | Less as it does not have all convertible securities. | More as it includes convertible securities in the calculation. |
| What includes in the calculation? | Common shares. | Common shares, preferred shares, stock options, warrants, debt, etc. |
| Calculation | (Net Income – Preferred Dividend) / Outstanding common shares. | (Net Income + Convertible Preferred Dividend + Debt Interest) / All convertible securities plus common shares. |
| Value of measure | More since the denominator is only common shares. | Less since the denominator includes all convertible securities. |
| Ease of use | Easy. | Comparatively complex. |
Conclusion
Basic EPS and diluted EPS go hand in hand. If its capital structure is quite difficult, it is always better to go for both.
Ascertaining both will help you find out the basic difference between them. And you would be able to see the earnings per share of a company under a very conservative measure. So, though only basic calculating and diluted EPS will not provide you with every minor detail of the company’s financial health, they can be a good start.
Recommended Articles
This article is a guide to Basic EPS vs Diluted EPS. We discuss the top differences between basic and diluted EPS, infographics, and a comparative table. You may also look at the following articles to enhance your accounting knowledge: –