Full Form of EPS – Earnings Per Share
The Full Form of EPS stands for Earnings Per Share. EPS is the ratio of net income to the total number of ordinary shares issued by the company. This is the ratio that generally indicates the profitability of the business. Investors, stakeholders, and analysts use the earnings per share calculator to gauge the performance of a company.

The earnings per share are the ratio financial analysts and investors use in investment and profitability analyses. It is normally computed as the ratio of net income to the total number of issued common shares. It helps in letting each investor know how much he is liable to get from the business in the form of earnings.
Earnings Per Share Explained
Earnings per share or EPS is a fundamental measure of a company’s profitability and a critical indicator for investors. It represents the portion of a company’s net earnings attributed to each outstanding share of its common stock. EPS is calculated by dividing the company’s net income after taxes by the number of outstanding shares.
EPS provides valuable insights into a company’s financial performance on a per-share basis, making it easier for investors to assess its profitability and growth potential. A higher EPS indicates that a company is generating more profit for each share, which is generally seen as a positive sign for investors.
The two types of earnings per share equation are the basic EPS, which is the more straightforward calculation and considers only the number of common shares outstanding. It doesn’t take into account potential dilution from securities like stock options or convertible bonds.
The other type is diluted EPS which factors in the potential dilution from convertible securities and stock options. It reflects the worst-case scenario by assuming all potentially dilutive securities are exercised.
Investors often look at both basic and diluted EPS to assess the potential impact of securities that could be converted into common shares in the future.
EPS is a crucial metric for investors, as it helps them evaluate a company’s profitability, compare it to competitors, and make informed investment decisions. However, it’s essential to consider EPS in conjunction with other financial metrics and the company’s overall financial health to get a comprehensive view of its performance.
Objectives
Let us understand the objectives of the earnings per share equation through the points below.
Key Takeaways
- The broad objective of the EPS is to indicate the profitability of the business.
- The business may report EPS after adjusting extraordinary line items, followed by potential adjustments.
- If the EPS is high, it indicates that the overall profitability of the business has appreciated over time.
Formula
EPS can be determined as per the relationship described below: –
Earnings Per Share = Net Income / Total Number of Shares Outstanding
- At times EPS could be determined using the weighted average of the outstanding shares.
- It accounts for the stock splits and stock dividends during the accounting period.
- It could be adjusted for preferred dividends and extraordinary items.
- The formula of EPS that accounts for the preferred dividends and extraordinary items can be expressed as follows: –
Earnings Per Share = (Net Income – Preferred Dividends – Extra-ordinary Items) / Total Number of Shares Outstanding.
Basic EPS Explanation in Video

Types
Two broad types of EPS are classified as basic EPS and diluted EPS.

#1 – Basic EPS
- The basic eps only focus on the total number of outstanding common shares.
- The basic eps do not account for any stock dilutions or conversion.
#2 – Diluted EPS
- The diluted EPS focuses on the dilutions arising out of the stock conversions and splits that can affect the value of the earnings per share.
- It comes into picture when there are stock options and warrants etc.
- Determining diluted EPS happens by accounting for warrants, convertibles, and options.
- Whenever options, warrants, and convertibles are exercised, they deduct from the basic earnings per share.
- After exercising options, warrants, and convertibles, the total number of issued shares tends to appreciate, thereby reducing the overall earnings per share.
- It is a key metric for a business with a complex capital structure.
Examples
Now that we understand the basics, formula, and types of earnings per share equation, let us apply the theoretical knowledge to practical application through the examples below.
Example #1
Let us take the example of the company ABC. During the year, the company generates a net income of $50,000,000. The company, as of date, has issued 5,000,000 shares. Help the management determine the earnings per share.
Solution
Calculation of earnings per share is as follows,

- = $50,000,000 / 5,000,000
- EPS =$10.
Therefore, the business has eps of $10.
Example #2
Let us take the example of company XYZ. During the year, the company generates a net income of $25,000,000. The company, as of date, has issued 2,000,000 shares. After the event of dilution, the business now has 2,500,000 outstanding. Help the management determine the basic and diluted earnings per share.
Solution
Calculation of earnings per share is as follows,
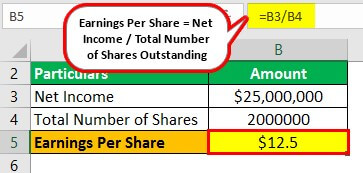
- = $25,000,000 / 2,000,000
- Earnings Per Share =$12.5
Calculation of earnings per share is as follows,

- = $25,000,000 / 2,500,000
- EPS =$10
Therefore, the business has the basic earnings per share of $12.5 and diluted earnings per share of $10.
Importance
The earnings per share calculator is an important metric for investment analysis as it helps in a comprehensive analysis and evaluation of the investment. However, since the metric is open for manipulation, investors should not rely on this metric alone. They should supplement it with additional metrics that help in the investment evaluation.
Benefits
Earnings per share equations convey how much residual income or earning each shareholder is liable to get.
- It is an important metric used for industry analysis.
- It is also used in the ratio analysis for comparable periods.
Limitations
Despite the various advantages mentioned above, there are a few factors that prove to be a disadvantage. Let us understand them through the points below.
- It can be distorted or misrepresented if the company pursues any buyback of shares.
- Since the business can exercise its discretion on what they want to report on earnings per share could, therefore, make this metric open for huge manipulation.
- It does not broadly account for financial leverage or lets the investor know the impact of the leverage on the earnings.
Differences Between Earnings and Dividends Per Share
Let us understand the differences between earnings per share equation and dividends per share through the comparison below.
- The dividend per share is defined as the ratio of the dividend paid to the stockholders to the total number of common shares.
- However, it takes into account the net income.
- Industry uses both metrics to analyze the profitability of the business.
- However, in the case of dividend per share, dividends are payable to the stakeholders from the portion of the net income.
Recommended Articles
This has been a guide to the Full Form of EPS, i.e., Earnings Per Share & its definition. We explain its types, examples, benefits, and limitations. You may refer to the following articles to learn more about finance –