Part of our Profitability Ratios guide
What are Basic Earnings Per Share?
Basic earnings per share is a profitability metric that calculates the company’s net income for each common stock. It is useful when the company has a simple capital structure (no dilutive securities like stock options, convertible bonds, etc.)
- Basic earnings per share (EPS) is a key profitability measure that indicates a company’s net income per common stock.
- It is suitable when a company has a simple capital structure without dilutive securities like stock options or convertible bonds. Basic EPS can also be used as a valuation method.
- When analyzing a company’s EPS, it’s important to consider net profit and outstanding equity shares separately.
- Basic EPS represents earnings available to common shareholders, so it deducts the current year’s preferred dividends from net income.
Basic EPS Formula
Basic EPS Formula = (Net Income – Preferred Dividends) / Weighted Average Common Shares Outstanding
Since basic EPS relates to earnings available only to common shareholders, the current year’s preferred dividends reduce from net income. However, dividends on common shares do not deduct from net income.
Calculate Basic EPS
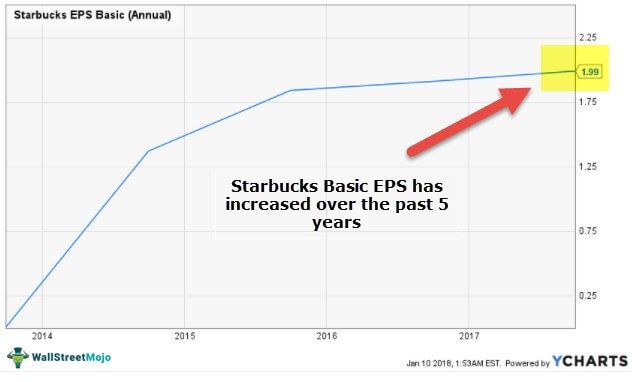
The above chart shows that Starbucks ‘ basic EPS has increased substantially over the past 5 years. What does this mean? How is this useful for investors? First, let us look at the calculation of the basic EPS of Starbucks and its interpretation.
2017
- Net earnings of Starbucks in 2017 = $2,884.7 million
- Weighted average common shares 2017 = $1,449.5 million
- Basic EPS = $2,884.7/1,449.5 = $1.99
2016
- Net earnings of Starbucks in 2016 = $2,817.7 million
- Weighted average common shares in 2016 = $1,471.6 million
- Basic EPS = $2,817.7/1,471.6 = $1.91
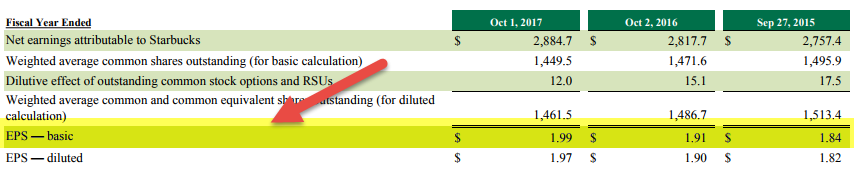
source – Starbucks 10K filings
Basic EPS Explanation in Video

How Useful is Basic EPS to the Investors?
- EPS is one of the best measures of profitability. As a result, every investor looks at EPS before investing in the company. And it gives them a clear idea about what to expect from the company in the future. However, only looking at basic EPS would not offer them the right insights. They should also look at all the financial statements and find the ratios from the data points they could gather.
- It is pretty easy to prepare. But, first, you need to grab an income statement of the company and the balance sheet. Then, take the net income from the income statement, deduct the preferred dividend (if any), and divide the figure by the outstanding equity shares. And, you will get a figure to look up.
- If you have been thinking of investing in any one of the companies, you can look at the EPS of each company and then decide which company provides more value per share. You can compare and understand, which makes the decision-making process easier.
- One may also use it in the relative valuation method. For example, it helps figure out the price-earnings ratio of a comparable company.
- Since it is the indicator of how much net profit earns if a company has a higher basic earnings per share, its net profit is also higher.
How to Interpret Basic EPS?
When comparing the EPS of two companies, you need to look at an important aspect.
- Suppose you are looking at A Co. and B Co. You found that both companies’ EPS is $5 per share.
- It will not be the right interpretation if you conclude that these companies perform similarly.
- If A Co. has 10,000 outstanding shares, the net profit (no preferred dividend) is $50,000.
- And let us also say that B Co. has 2,000 outstanding shares, and the net profit (no preferred dividend paid) is $10,000.
- These cases will portray the same basic EPS, but are they similar in net profits? No. A Co. makes more profit than B Co. Since B Co. has fewer outstanding shares, it seems it has been doing quite well.
While looking at a company and its EPS, you should look separately at the net profit and the outstanding equity shares.
Limitations
Basic EPS is a great measure of profitability. There is no doubt about it. But you should know that EPS alone cannot depict a great deal about a company’s financial health.
Yes, it can talk about how much net profit a company has been earning, whether a company is generating higher yields, and whether one company is doing better than another in terms of earnings per share.
Since the company has prepared the income statement and the balance sheet, it may have manipulated the data to showcase a good reputation to its potential investors.
That is why you should look at the P/E ratio (Price/Earnings ratio) and basic EPS. However, it would help if you also looked at other financial ratios like return on total assets, ROCE, diluted EPS, and the statements like cash flow and fund flow statements.
Frequently Asked Questions (FAQs)
1. What is the difference between EPS and basic EPS?
EPS stands for Earnings Per Share, a financial metric representing the portion of a company’s profit allocated to each outstanding share of common stock. Basic EPS considers only the number of common shares outstanding, while diluted EPS takes into account the potential dilution from convertible securities, such as stock options or convertible bonds.
2. What is a good basic EPS number?
The determination of a “good” basic EPS number depends on various factors, including the industry, company size, growth prospects, and investor expectations. A higher basic EPS generally indicates greater profitability per share, but it’s essential to consider the context and compare it with industry peers or historical performance for a meaningful assessment.
3. Which is better, basic or diluted EPS?
Whether basic or diluted EPS is better depends on the purpose of the evaluation. Basic EPS provides a conservative measure by assuming no potential dilution from convertible securities. On the other hand, diluted EPS accounts for the potential dilution of outstanding shares. If significant dilutive securities are in circulation, diluted EPS may give a more accurate representation of the company’s earnings potential.
Recommended Articles
This article is a guide to Basic EPS. Here, we discuss the formula for calculating basic earnings per share, practical examples, and its usefulness to investors. You may also have a look at these articles below to enhance your understanding of: –
- Profitability
- EPS – Full Form
- Basic Excel Formulas
- Top 10 Basic Accounting Books
- Compare – Basic EPS vs. Diluted EPS
Recommended Articles
Continue with these closely related articles from the same guide.