What is a Degree of Operating Leverage (DOL)?
Degree of Operating Leverage measures the sensitivity of a company’s operating income with changes in sales; a higher DOL implies a higher proportion of fixed cost in the business operations, whereas lower DOL implies lower fixed cost investment in running the business.
Key Takeaways
- The degree of operating leverage determines the company’s operating income sensitivity to changes in sales.
- This concept considers the proportion of the fixed and variable costs in the company’s overall cost structure.
- If the DOL is high, the earnings before interest and taxes (EBIT) are more sensitive to the percentage change in sales. All other variables are the same, and vice versa.
- A high operating leverage means that an overall cost structure’s large proportion is due to fixed costs. In comparison, variable costs contribute much of its overall cost structure in a low operating leverage.
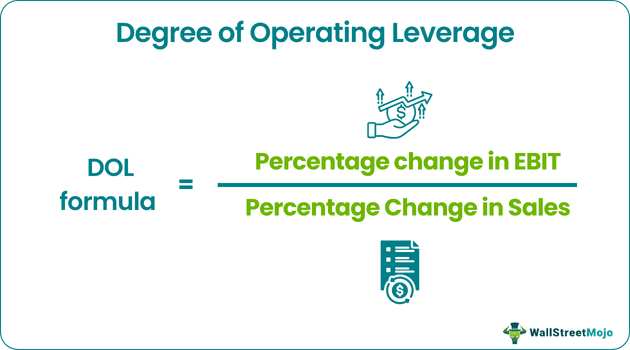
Degree of Operating Leverage Formula
The formula is used to determine the impact of a change in a company’s sales on the operating income of that company.
- The concept of DOL revolves around the proportion of fixed costs and variable costs in the overall cost structure of a company.
- A company with a higher proportion of fixed costs has a higher DOL than a company with a higher proportion of variable costs.
- If the DOL is high, then the earnings before interest and taxes (EBIT) are more sensitive to the percentage change in sales while all other variables remain the same and vice versa.
The formula of Degree of Operating Leverage (DOL) is derived by dividing the percentage change in the EBIT by the percentage change in the sales, and it is represented as,
Formula = Percentage change in EBIT / Percentage change in sales
Formula = Contribution margin / EBIT
It can be further expanded as shown below,
Degree of Operating Leverage Formula = (Sales – Variable cost) / (Sales – Fixed cost – Variable cost)
Explanation
Next, determine the sales during the current year and the previous year. Now, compute the percentage change in sales initially by deducting the sales of the previous year from that of the current year and then dividing the result by the sales of the previous year as shown below,
The formula can be derived by using the following three steps:
- Firstly, determine theoperating income vs. EBITduring the current and previous years. Now, compute the percentage change in EBIT initially by deducting the EBIT of the previous year from that of the current year and then dividing the result by the EBIT of the previous year as shown below,
Percentage change in EBIT = (EBITcurrent yearEBITprevious year)/ EBITprevious year* 100%
- Next, determine the sales during the current year and the previous year. Now, compute the percentage change in sales initially by deducting the sales of the previous year from that of the current year and then dividing the result by the sales of the previous year as shown below,
Percentage change in sales = (Salescurrent yearSalesprevious year)/ Salesprevious year* 100%
- Finally, the formula can be calculated by dividing the value in Step 1 by that of Step 2 as above.
Examples
Let’s see some simple to advanced examples to understand them better.
Example #1
Let us take the example of Company A, which has clocked sales of $800,000 in year one, which further increased to $1,000,000 in year two. In year one, the operating expenses stood at $450,000, while in year two, the same went up to $550,000. Determine the DOL for Company A.
Use the following data for the calculation of the Degree of Operating Leverage.
| Particulars | Year 1 | Year 2 |
|---|---|---|
| Sales | $8,00,000 | $10,00,000 |
| Operating Expense | $4,50,000 | $5,50,000 |
EBIT in year 1

- EBIT in year 1 = Sales in year 1 – Operating expense in year 1
- = $800,000 – $450,000
- = $350,000
EBIT in Year 2

- EBIT in year 2 = Sales in year 2 – Operating expense in year 2
- = $1,000,000 – $550,000
- = $450,000
Change in EBIT

- Change in EBIT = EBIT in year 2 – EBIT in year 1
- = $450,000 – $350,000
- = $100,000
Percentage Change in EBIT

- Percentage change in EBIT = Change in EBIT / EBIT in year 1 * 100%
- = $100,000 / $350,000 * 100%
- = 28.57%
Change in Sales

- Change in sales = Sales in year 2 – Sales in year 1
- = $1,000,000 – $800,000
- = $200,000
Percentage Change in Sales

- Percentage change in sales = Change in sales / Sales in year 1 * 100%
- = $200,000 / $800,000 * 100%
- = 25.00%
Calculation of Degree of Operating Leverage will be –

Now, DOL Formula = Percentage change in EBIT / Percentage change in sales
- DOL Formula= 28.57% / 25.00%
- = 1.14
Therefore, the DOL of Company A is 1.14.
Example #2
Calculate Degree of Operating Leverage for Company B. Let us take the example of another Company, B, which is in the business of chocolate manufacturing and, in the current year, has achieved a sales volume of 18,000 pieces with an average sales price of $50 per piece. The company’s overall cost structure is such that the fixed cost is $100,000, while the variable cost is $25 per piece.
Use the following data for the calculation of the Degree of Operating Leverage.
| Sales Volume | 18000 |
| Average Sales Price Per Piece | $50 |
| Variable Cost Per Piece | $25 |
| Fixed Cost | $1,00,000 |
| Sales | $9,00,000 |
| Variable Cost | $4,50,000 |
Sales = Sales volume * Average sales price per piece
- = 18,000 * $50
- = $900,000
Variable cost = Sales volume * Variable cost per piece
- = 18,000 * $25
- = $450,000
Contribution Margin

Contribution margin = Sales – Variable cost
- = $900,000 – $450,000
- = $450,000
EBIT

EBIT = Sales – Variable cost – Fixed cost
- = $900,000 – $450,000 – $100,000
- = $350,000
Calculation will be as follows –

Now, DOL Formula = Contribution margin / EBIT
- DOL Formula = $450,000 / $350,000

- = 1.29
Therefore, the DOL of Company B is 1.29.
Relevance and Uses
It is important to understand the concept of the DOL formula because it helps a company appreciate the effects of operating leverage on the probable earnings of the company. It is a key ratio for a company to determine a suitable level of operating leverage to secure the maximum benefit out of a company’s operating income.
If a company has high operating leverage, then it means that a large proportion of its overall cost structure is due to fixed costs. Such a company will enjoy huge changes in profits with a relatively smaller increase in sales. On the other hand, if a company has low operating leverage, then it means that variable costs contribute a large proportion of its overall cost structure. Such a company does not need to increase sales per se to cover its lower fixed costs, but it earns a smaller profit on each incremental sale.
Nevertheless, a company with high operating leverage should always keep in mind that vis-à-vis a company with low operating leverage, it is more vulnerable to poor corporate decisions and other variables that may significantly decrease income.
Frequently Asked Questions (FAQs)
Can the degree of operating leverage be negative?
No. The degree of operating leverage can never be harmful since it is a two-positive numbers ratio, i.e., sales and operating income. Moreover, the negative operating leverage implies that the operating income decreases as the revenue increases, which is inconsistent with the traditional definition of operating leverage.
What degree of operating leverage is better?
The high operating leverage can be better than the low. It lets businesses gain significant profits on every progressive sale. On the contrary, companies having low operating leverage may find it effortless to earn a profit when trading with lower sales.
How can a high degree of operating leverage be risky for a company?
High operating leverage can be risky for a company in several ways, including reduced flexibility, magnified effects of revenue changes, financial risk, and strategic risk.
Recommended Articles
This article has guided the Degree of Operating Leverage (DOL) Formula. Here we discuss how to calculate the Degree of Operating Leverage using practical examples and downloadable excel templates. You may learn more about Financial Analysis from the following articles –