Operating Leverage Meaning
Operating leverage is an accounting metric that helps the analyst in analyzing how a company’s operations are related to the company’s revenues; the ratio gives details about how much operating profit increase the company will have with a specific percentage of sales increase.
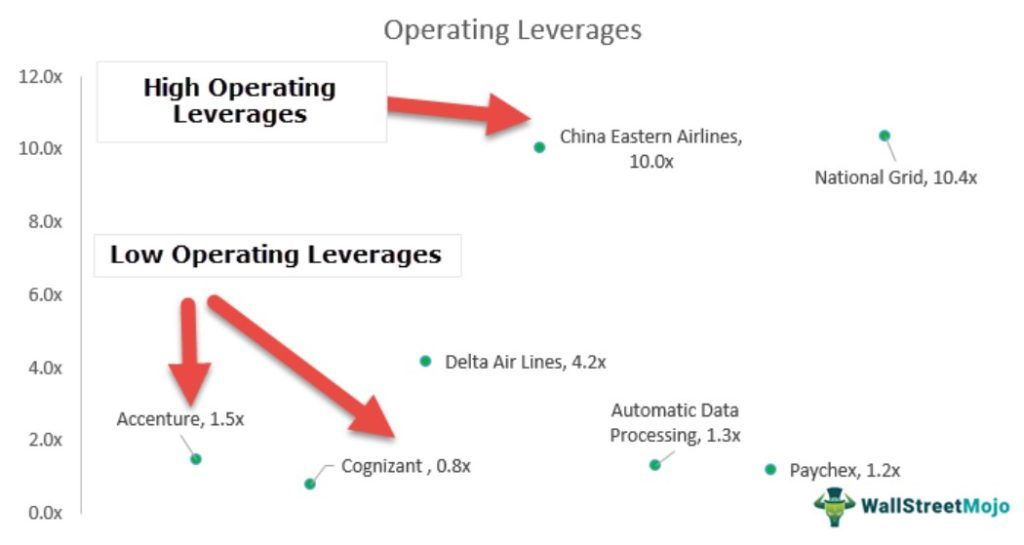
Alternatively, Operating Leverage can be defined as the capability of the firm to use its fixed expenses to generate better returns. For example, the above graph notes that companies like Accenture, Cognizant, Automatic Data Processing, and Paychex have lower leverage (~1.0x). In contrast, companies like Delta Airlines, China Eastern Airlines, and National Grid have a higher Leverage.
Key Takeaways
- Operating Leverage is the relation between a company’s operations and revenue from operations and the profitability that the company derives.
- Different types of costs are associated with Operating Leverage, such as – Fixed Costs, the costs that are fixed in nature and don’t depend on the sales.
- In contrast, the variable costs depend on the company’s operations, followed by the semi-fixed, semi-variable costs, which are variable or fixed in nature up to a limit, or a small percentage of the company’s production capacity.
- A lower operating leverage cost means more variable costs and reduced fixed costs, indicating that the company has to earn to break even.
- In comparison, a high operating leverage cost means more fixed costs and lower variable costs, indicating that the company already reaches break-even.
Operating Leverage Explained
As we all know, no product is manufactured free of cost by any organization. Finally, various costs are incurred to bring the product to the shelf, ready for the consumers to buy and consume. All these costs incurred can be bifurcated into two main categories – fixed costs and variable costs. It is important to understand the meaning of fixed and variable costs first.
Fixed cost, as the name suggests, will not change irrespective of the number of units produced. The rent of a factory, which as organization pays every month, will remain fixed, irrespective of the fact that they produce 500 or 5000 units of the product.
But as opposed to fixed costs, variable costs vary with the number of units produced. In other words, they are directly proportionally with units produced. For instance, raw materials are consumed to produce the finished product. Say the company is in the business of assembling a mobile phone, and the battery is a raw material for the company. In this case, the cost of batteries consumed will be a variable cost for the company as the volume is dependent directly on the volume of the total production of mobile phones in a given period.
Again, there are also semi-variable and semi-fixed costs that are used while analyzing the operating leverage of an entity, which are neither completely fixed nor completely variable.
Leverage means the use of fixed costs in the organization’s capital structure. Since it remains fixed, a small variation in revenue and lead to a huge change in profit or loss for the entity. Thus, the operating leverage help analysts understand the company’s present condition and future prospects.
Video Explanation of Operating Leverage
Significance
Operating leverage calculation measures the company’s fixed costs as a percentage of its total costs. Therefore, a company with a higher fixed cost will have high operating leverage than a higher variable cost.
Lower operating leverage –
- This implies lower fixed costs and higher variable costs. In this case, a company has to achieve minimum sales, covering its fixed costs. Once it crosses the break-even point where all its fixed costs are covered, it can earn profit.
- Once it crosses the break-even point where all its fixed costs are covered, it can earn incremental profit in terms of Selling Price minus the Variable Cost, which will not be very substantial as the variable costs are high.
- When the operating leverage is low and fixed costs are lower, we can safely conclude that the break-even units a company needs to sell to suffer a no loss & no profit equation will be comparatively lower.
Higher operating leverage –
- This implies lower variable costs and higher fixed costs. Here, as the fixed costs are higher, the break-even point will be higher.
- The company will have to sell the number of units to ensure no loss & no profit situation. On the other hand, the advantage here is that after the break-even is achieved, the company will earn a higher profit on every product as the variable cost is very low.
Companies generally prefer lower operating leverage so that even in cases where the market is slow, it would not be difficult for them to cover the fixed costs.
Related Topics – Income Statement Interpretation, Profit Margins
Formula
It is the percentage change in operating profit relative to sales. It is also known as the “Degree of Operating Leverage or DOL.” Please note that the greater use of fixed costs, the greater the impact of a change in sales on a company’s operating income.
Formula = % change in EBIT / % change in Sales.
Let us take a simple example.
- Sales 2015 = $500, EBIT 2015 = $200
- Sales 2014 = $400, EBIT 2014 = $150
- % change in EBIT = ($200-$150)/$150 = 33%
- % change in Sales = ($500-$400)/$400 = 25%
- Degree of Operating Leverage = 33/25 = 1.32x
This means that Operating profit changes by 2% for every 1% change in Sales.
Also, have a look at EBIT vs. EBITDA – Top differences.
Examples
Let us look at some examples to understand the concept.
Example #1
Let us look at the case of Colgate.
- Colgate’s DOL = % change in EBIT / % change in Sales.
- I have calculated the operating leverage ratio for each year from 2008 – to 2015.
- Colgate’s DOL is very volatile as it ranges from 1x to 5x (excluding the year 2009 where sales growth was almost 0%).
- It is expected that Colgate’s DOL will be higher as we note that Colgate has made significant investments in Property, plant, equipment and intangible assets. These long-term assets account for more than 40% of the total assets.

Example #2
Let us now do the operating leverage calculation to understand Amazon’s DOL. Below is Amazon’s Income Statement for 2014, 2015, and 2016.

source: Amazon SEC Filings
DOL formula = % change in EBIT / % change in Sales
DOL of Amazon – 2016
- % change in EBIT (2016) = (4,186-2,233)/2,233 = 87%
- % change in Sales (2016) = (135,987 – 107,006)/107,006 = 27%
- Amazon’s DOL (2016) = 87% / 27% = 3.27x
DOL of Amazon – 2015
- % change in EBIT (2015) = (2,233- 178)/174 = 1154%
- % change in Sales (2015) = (107,006 – 88,988)/88,988 = 20%
- Amazon’s DOL (2015) = 1154% / 20% = 57.02x
Reasons for Higher Leverage for Amazon
Amazon has a high operating leverage due to the following:
- Higher Fixed Costs
- Lower Variable Costs
Example #3
Let us look at the case of Accenture.

source: Accenture SEC Filings
DOL Formula = % change in EBIT / % change in Sales
DOL of Accenture – 2016
- % change in EBIT (2016) = (4810,445 – 4,435,869)/4,435,869 = 8.4%
- % change in Sales (2016) = (34,797,661 – 32,914,424)/32,914,424 = 5.7%
- Accenture’s DOL (2016) = 8.4% / 5.7% = 1.5x
DOL of Accenture – 2015
- % change in EBIT (2015) = (4,435,869 – 4,300,512 )/4,300,512 = 3.1%
- % change in Sales (2015) = (32,914,424 – 31,874,678)/31,874,678 = 3.3%
- Accenture’s DOL (2015) = 3.1% / 3.3% = 0.96x
Reasons for low DOL of Accenture
- Lower Fixed Costs
- Higher Variable Costs. Such companies bill clients on a per-hour basis, and variable costs are in the form of developers’/consultant salaries.
- Lower Fixed Costs
- Higher Variable Costs. Such companies bill clients on a per-hour basis, and variable costs are in the form of developers’/consultant salaries.
Advantages And Disadvantages
Let us look at some advantages and disadvantages of operating leverage.
Advantages
- It helps to analyze the type of business. If operating leverage is high, it means the company is capital-intensive.
- It helps the business to calculate the break-even point. The revenue earned should be able to cover the costs of the business.
- It helps the firm to understand the level of operating risk. If the firm has to incur high operating costs, its operating risk is high, which can be covered if it can earn high revenue.
- The firm can decide on a better sales strategy if operating cost is known.
Disadvantages
- High operating leverage makes the firm more sensitive to changes in revenue. A limited change in revenue will change the profit to a great extent since fixed cost remains the same.
- The firm has to earn high revenue to break even, which puts pressure on the operation process.
- A business with high operating costs finds it difficult to obtain financing easily.
Operating Leverage Vs Financial Leverage
Operating leverage is the use of fixed costs to increase the company’s revenue, where financial leverage is the use of financial risk to increase the company’s revenue. However, there are some differences between them, as follows:
| Operating Leverage | Financial Leverage |
| It involves the use of fixed cost | It involves the use of financial risk. |
| It affects the operating cost. | It affects the expenses related to interest on the debt. |
| It is related to the cost structure. | It is related to the capital structure. |
| It results in business risk. | It results in financial risk for the entity. |
Frequently Asked Questions (FAQs)
How to interpret whether the operating Leverage is good or not?
Operating leverage is the primary indicator comparing a company’s fixed costs with variable costs. Higher operating Leverage means the company has more fixed costs, which means the company utilizes fixed assets more efficiently and hence has a better chance of receiving more profits.
How can businesses improve their operating Leverage?
A company can improve operating Leverage through the acquisition of more fixed assets by the companies. It helps the company instigate more assets to support the core functioning, thus improving the operating Leverage.
Can the operating Leverage ever be zero?
The operating Leverage can be zero when the firm possesses no fixed assets. It will mathematically indicate that, in the company’s financials, the percentage change in EBIT will be the same as the percentage change in sales. Due to this, the operating Leverage is absent.
Recommended Articles
This article has been a guide to Operating Leverage & its meaning. We explain its formula, difference with financial leverage, examples, significance, advantages.