Financial Leverage Meaning
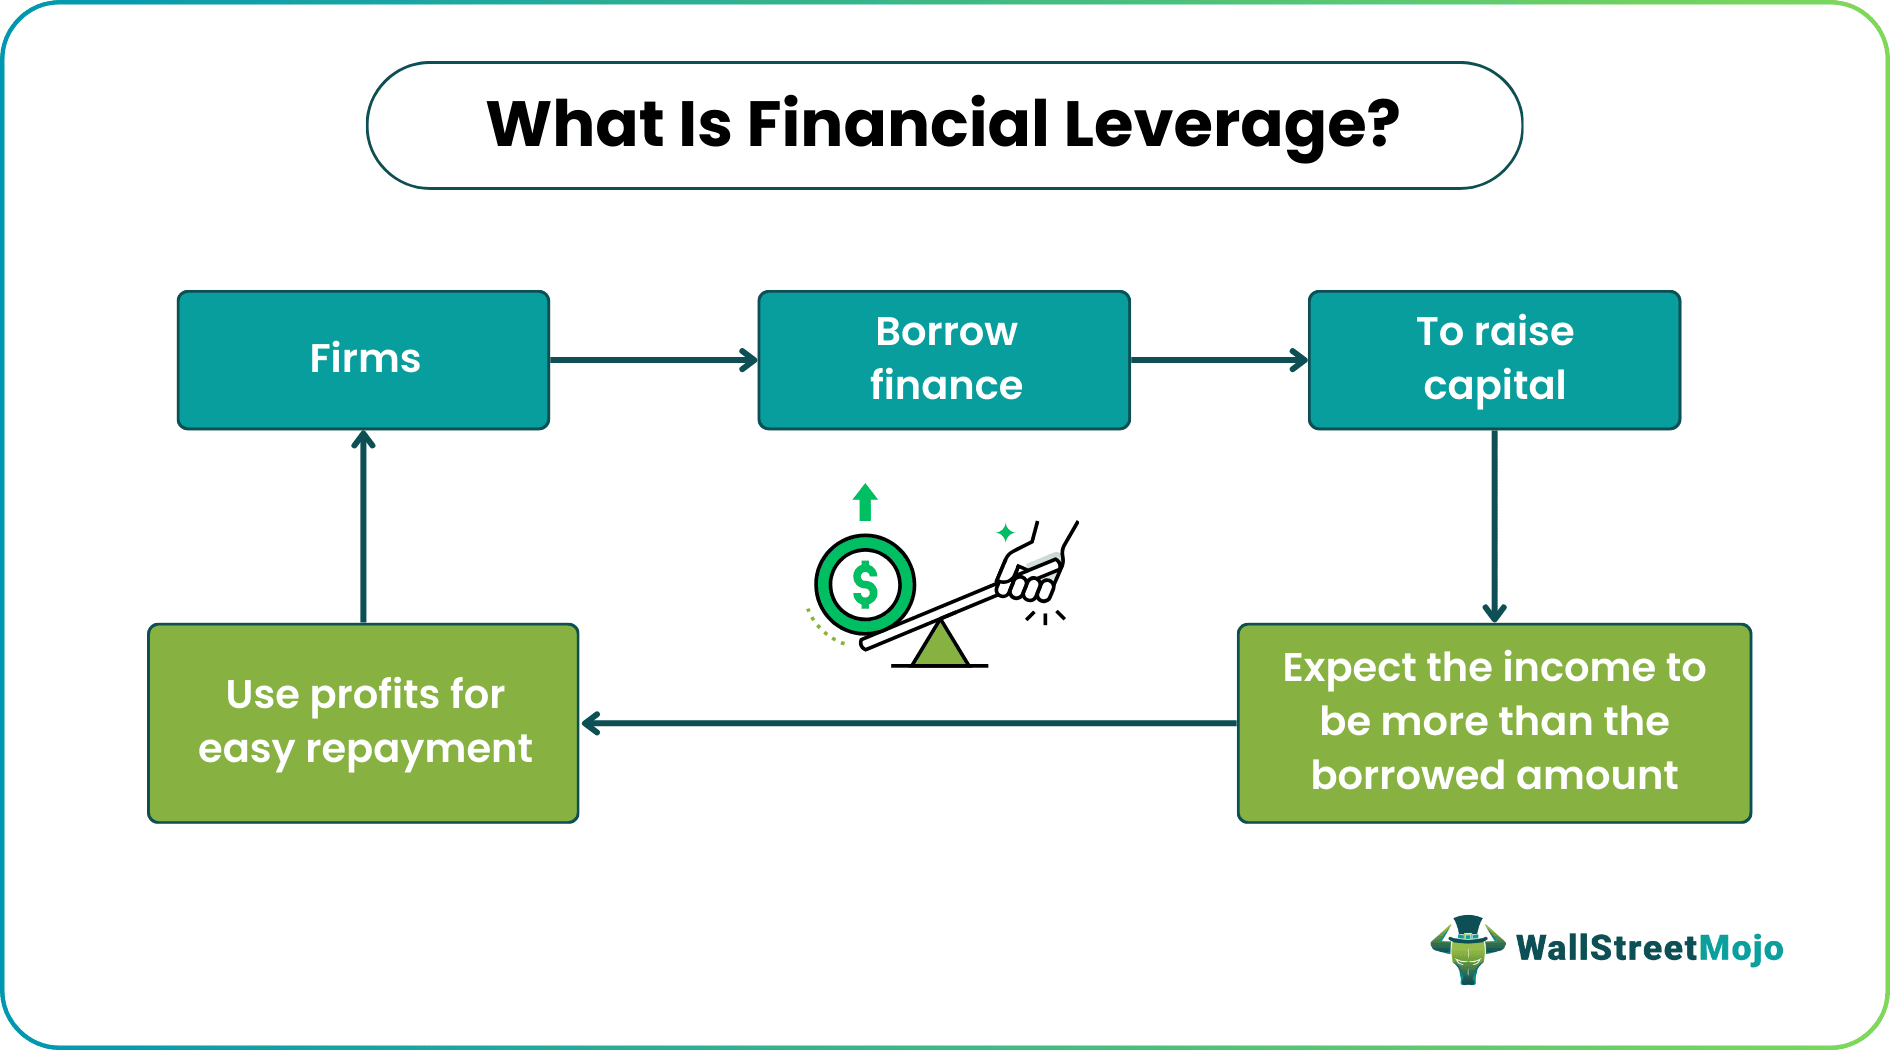
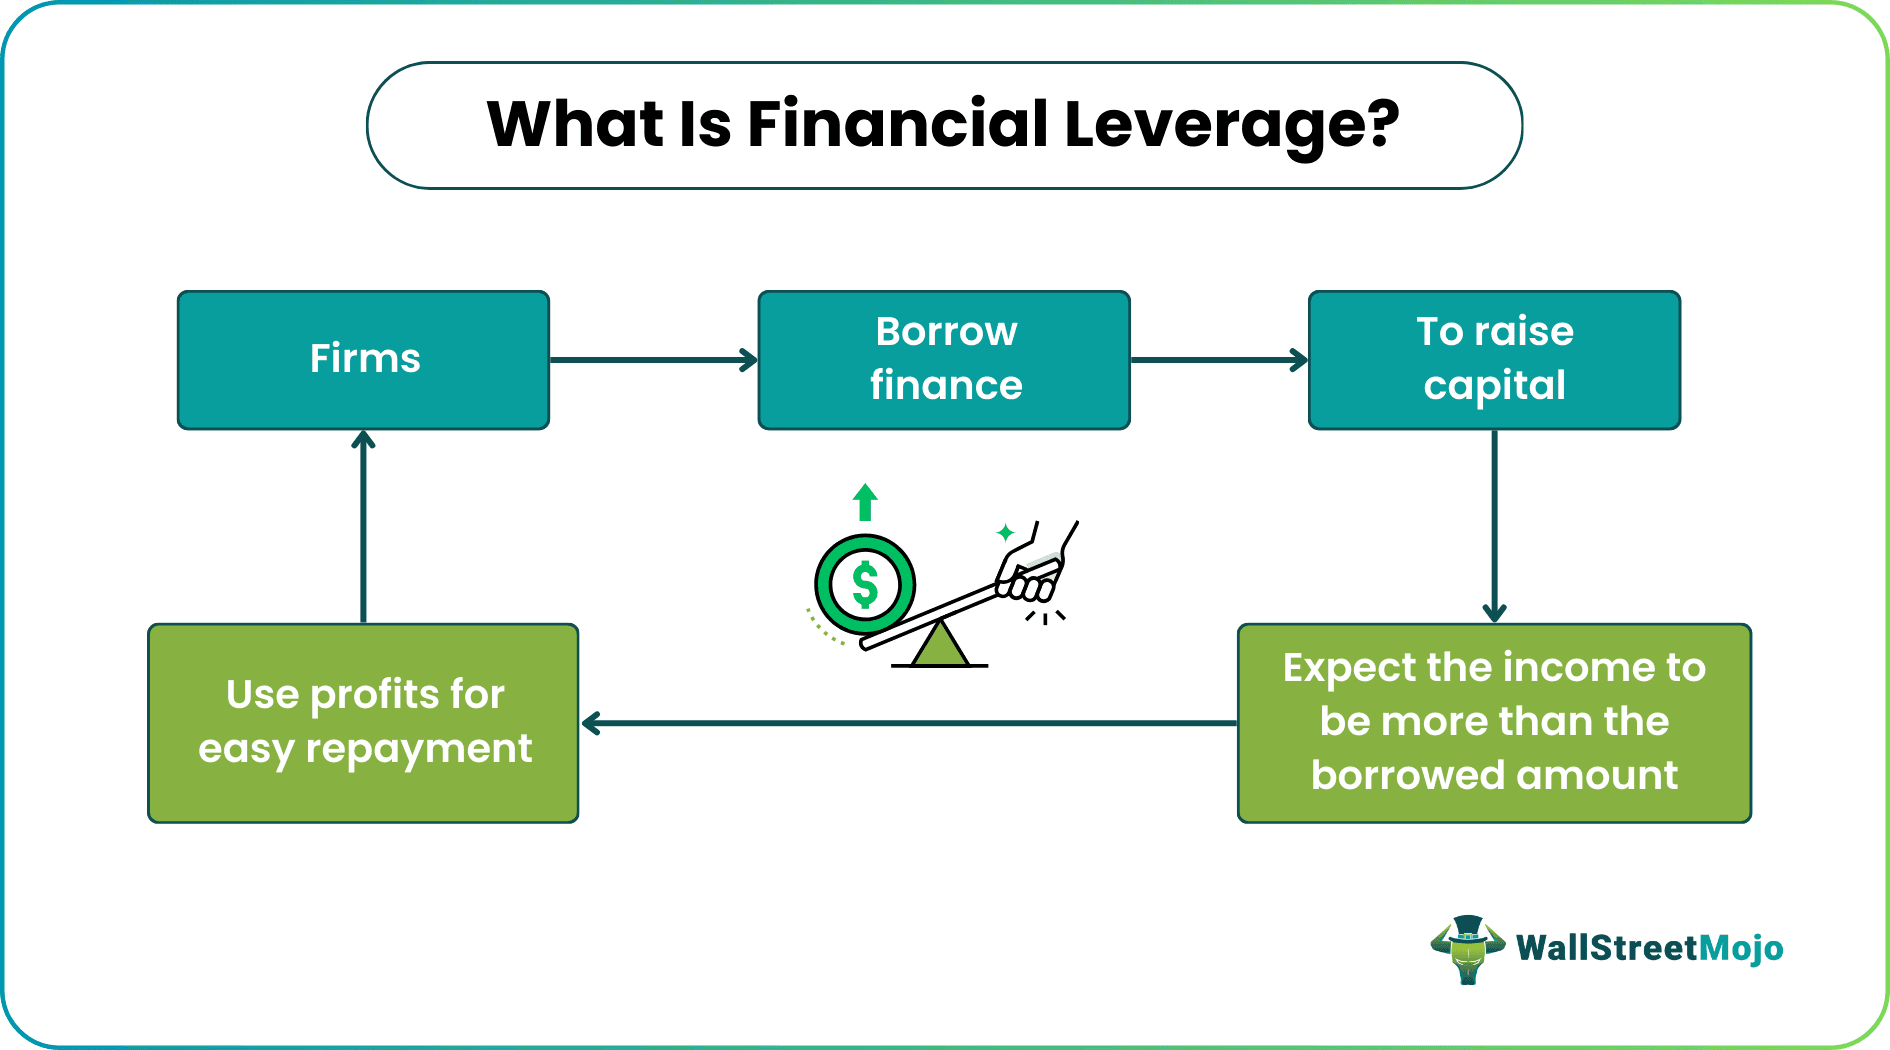
Financial leverage refers to using borrowed amount for purchasing assets to build capital and expand a business, with an expectation of earning or reaping gains, which would be more than the cost incurred in borrowing from lenders. Here, the assets purchased act as collateral until the loan is fully repaid along with interest.
The concept helps businesses to have funds to expand their venture and put efforts into earning more than their cost of borrowing. In addition, financial leverage also allows investors to have room for more returns on investment, which is the amount lent to businesses.
Key Takeaways
- Financial leverage involves using the borrowed money to build capital, expecting the income to be more than the debt.
- A higher value of leverage signifies that a company has more debt than equity.
- The leverage magnifies the firm’s profit while increasing the potential for loss.
- It is a good option for companies, but it involves severe risks, including bankruptcies.
How Does Financial Leverage Work?
Financial leverage is an investment strategy where businesses borrow money to buy assets and increase capital to expand their venture. The firms opt for this option only when they know that their investment has the potential to generate profits that could easily help them pay back their debt.
When a company is highly leveraged, it indicates that it has more debt than equity. In the process, companies borrow finances instead of issuing stocks to investors to raise capital. Though companies can also use equity to build assets, they prefer taking debts as the cost of borrowing is less than the cost of equity. As a result, the cost of capital gets reduced for companies. However, while debt gives a huge relief to businesses for a time being, it is quite risky. In the event of default, it might lead to bankruptcies.
The Degree of Financial Leverage or DFL is a ratio that indicates how likely is the EPS to be affected by the fluctuations in the gains that occur with the changing capital structure. DFL is measured and calculated using the following formula.
DFL = Change in EPS (%)/ Change in EBIT (%)
Here,
EBIT is the Earnings before Interest and Taxes
Video Explanation of Financial Leverage

Formula
The financial leverage formula, on the other hand, with regards to a company’s capital structure is as follows:
Financial leverage = Total Debt / Shareholder’s Equity
Here,
Total Debt = Short Term Debt + Long Term Debt
Effect
When the leverage value is higher, the company relies more on debt than on equity. High leverage makes lenders offer loans at a higher interest rate. As a result, the interest expenses of a company increase, negatively affecting its finances. However, the value should also not be too low as it would mean the company’s reliability on equity for raising funds. In scenarios where equity is more, the effect is adverse on the earnings per share (EPS).
On the contrary, leverage could be an effective way of understanding and assessing financial risks an organization might face. These risks include everything related to monetary transaction issues, such as taking up company loans and defaulting. Moreover, if the returns on investment are not as expected, the investors might incur severe financial losses.
Examples
Let us consider the following financial leverage examples to understand the concept better:
Example #1
Company A has purchased assets and resources for the latest order to be completed. The order received was likely to bring them a profit of $50,000. Thus, it decided to apply for a loan instead of issuing shares to investors. The company applied for a loan of $20,000 as it knew the capital built would help it earn more than what was to be repaid.
Example #2
Here is a real-life scenario where the debt and EPS of Nestle for two consecutive years – 2014 and 2015 – have been mentioned. In addition, the leverage is calculated using the formula above with respect to their debt to equity ratio.
| In millions of CHF | 2015 | 2014 |
| Total Debt (1) | 21230 | 21206 |
| Total Shareholder’s Equity (2) | 62,338 | 70,130 |
| Total Debt to Shareholder’s Equity | 34.05% | 30.23% |
The financial leverage, in this case, has increased from 30.23% in 2014 to 34.05% in 2015.
Financial Leverage vs Operating Leverage
Operating leverage and financial leverage are two forms of leverage prominently observed in an organization. When the two combine, it forms the hybrid version, referred to as combined leverage. The differences between these two types of leverage options have been listed below:
| Category | Operating Leverage | Financial Leverage |
|---|---|---|
| Meaning | Involves the use of fixed cost assets in the company’s operation | Involves borrowing money to build capital that makes businesses pay interests |
| Risk | Involves business risk | Involves financial risk |
| Relationship | Sales and EBIT | EBIT and EPS |
| Preferred | Less | More as the cost of borrowing is less |
Frequently Asked Questions (FAQs)
1. Is financial leverage considered good or bad?
Generally, a financial leverage ratio below one is considered favorable according to industry standards. However, if the ratio exceeds 1, lenders and potential investors may perceive the company as a risky investment. A financial leverage ratio surpassing 2 is particularly problematic and may raise concerns.
2. Is negative financial leverage beneficial?
Negative financial leverage occurs when the impact of leverage on cash-on-cash returns hampers profitability and investment viability, especially if the property’s cash flow fails to cover mortgage payments. Negative leverage can indicate a correction in the commercial real estate (CRE) market, capital markets, or both.
3. What is the impact of financial leverage?
When a company employs financial leverage, its return on equity can increase up to a certain point. This occurs because leverage heightens stock volatility, increasing risk and potentially leading to higher returns. However, companies that become excessively over-leveraged may experience a decline in their return on equity.
Recommended Articles
This is a guide to what is Financial Leverage and its meaning. Here, we explain how it works along with its degree, formula, effect, and examples. You may learn more from the following articles –