Part of our Leverage Ratios guide
What is the Capitalization Ratio?
Capitalization ratios are a set of ratios that help an analyst determine how the company’s capital structure will affect if an investment is made in the company. This set includes debt to equity, long-term debt to market cap, and total debt to market cap as helpful ratios.
Pepsi Debt to Equity was at around 0.50x in 2009-1010. However, it started rising rapidly and is at 2.792x currently. What does this mean for Pepsi? How did its Debt to Equity Ratio increase dramatically? Is this good or bad for Pepsi?
We try to understand how much a company has injected “debt” into its capital structure with this ratio. It’s simple; we will check out the proportion of debt in the total capital. To understand this, we need first to understand the capital structure.
The capital structure depicts the proportion of the equity and debt of a company’s capital. The rule of thumb is to maintain a 2:1 ratio between its equity and debt for any company. But in real life, it always doesn’t happen. So, we as investors need to look at it and ascertain how much equity and debt are in its capital.
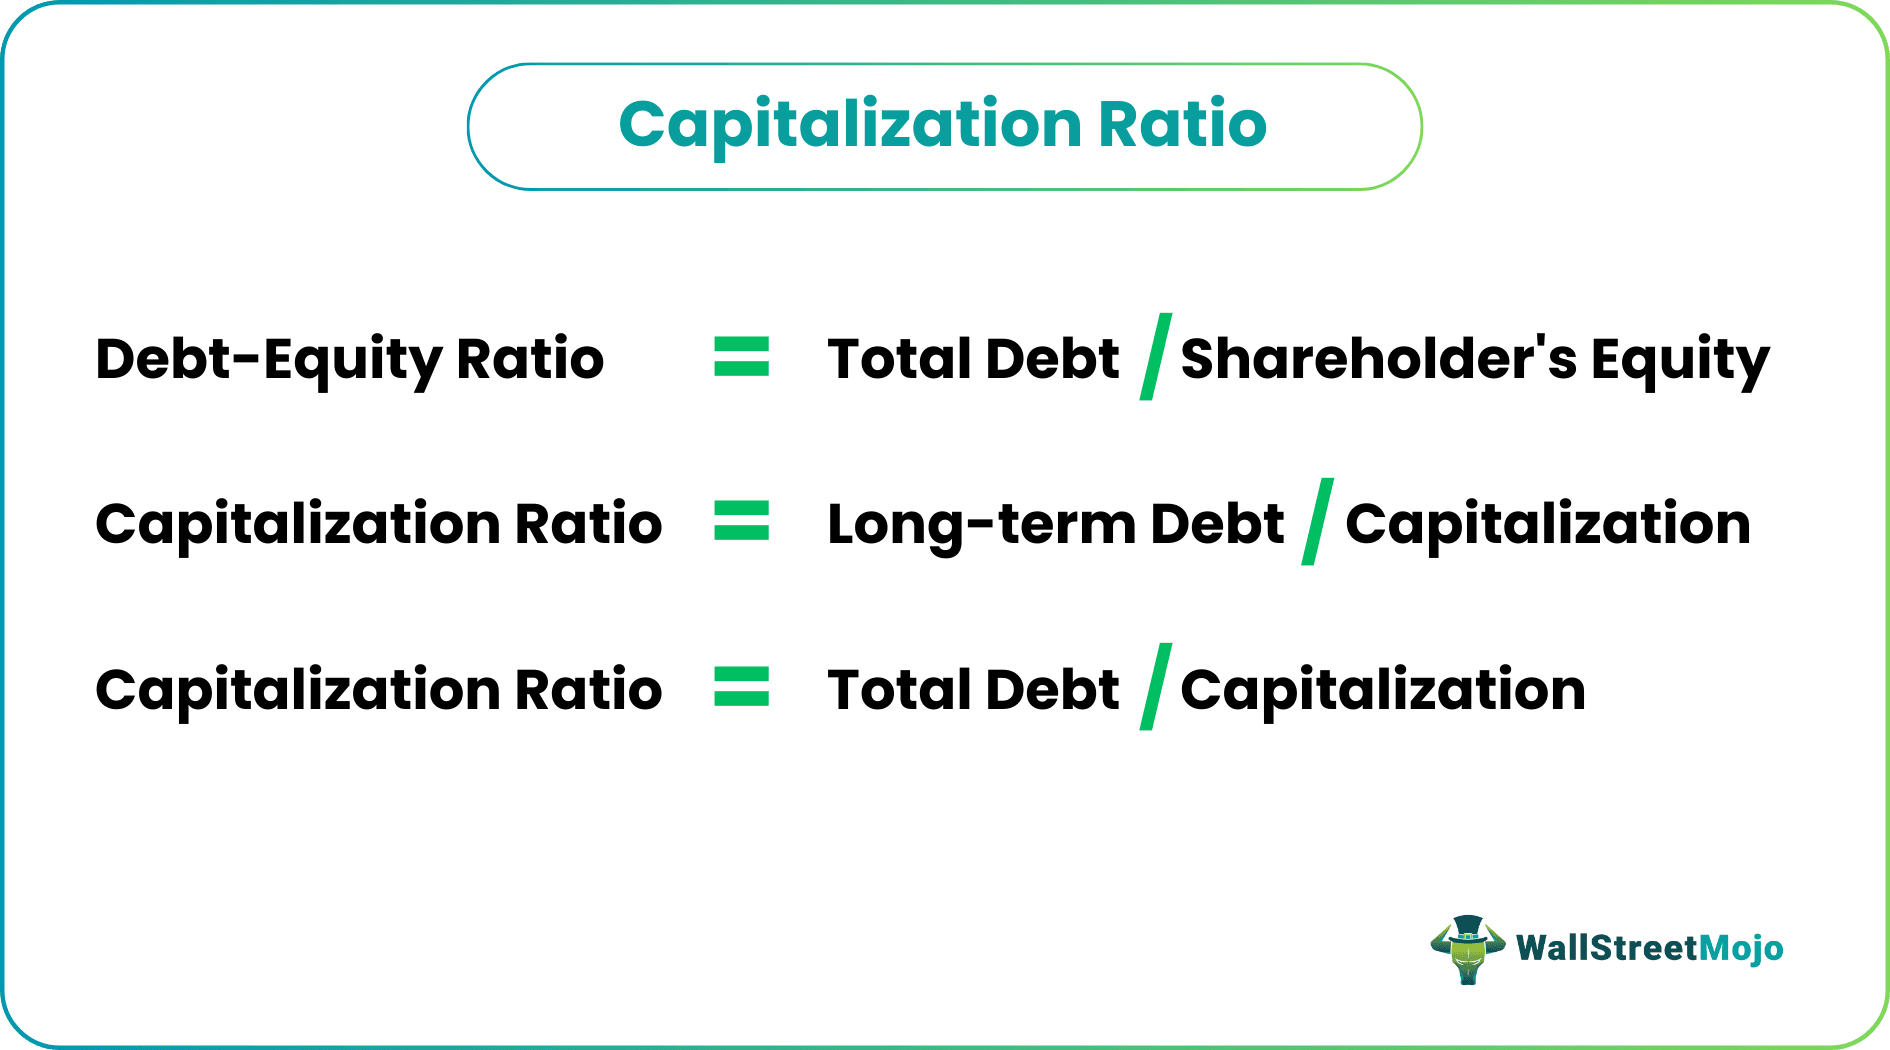
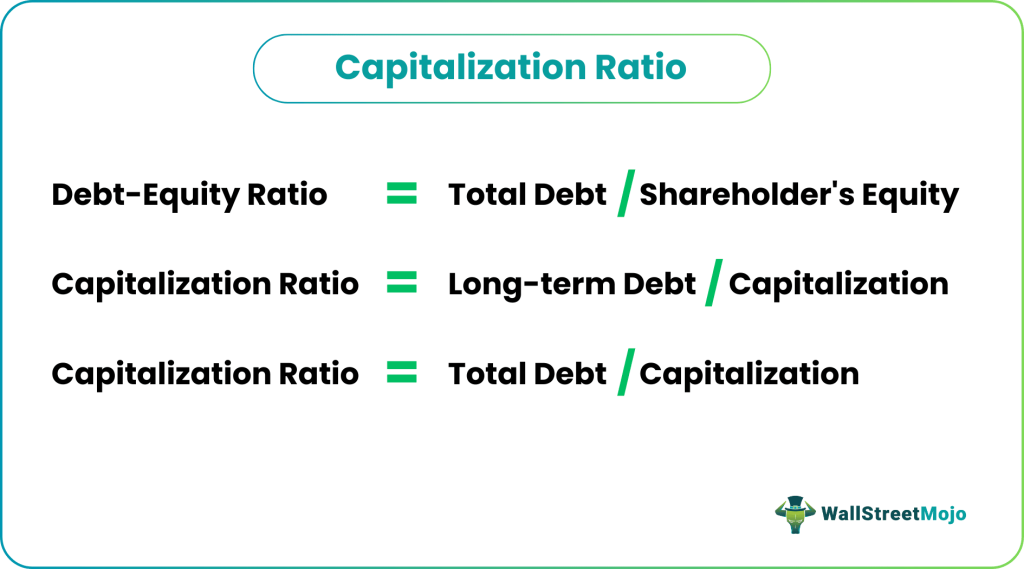
But only one ratio would not be able to give us an accurate picture. So we will look at three ratios through which we will understand the debt in the capital. This is also called the financial leverage ratio. So the three ratios that we will look at are – Debt-Equity Ratio, Long-term Debt to Capitalization Ratio, and Total Debt to Capitalization Ratio.
Let’s have a look at the formulas of these three ratios.
Capitalization Ratio Formula
Video Explanation of Capitalization Ratio

What is Capitalization Ratio?
#1 – Debt to Equity Ratio
First, let’s look at the Debt-Equity ratio.
Debt-Equity Ratio = Total Debt / Shareholders’ Equity
Here we will take the total debt into account and compare it with the shareholders’ equity. This is the basic capital structure ratio, which gives us an idea about how much debt and equity are injected into the company’s capital. Total debt includes short-term and long-term debt, and shareholders’ equity includes everything from share capital, reserve, non-controlling interest, and equity attributable to the shareholders.
In the case of a debt-free firm, the debt-equity ratio would be nil, and then the idea of this ratio is irrelevant.
#2 – Long Term Debt to Capitalization
Let’s have a glance at the next ratio.
Capitalization Ratio = Long term Debt / Capitalization
This is the first most important ratio of capitalization. We are looking at all three to understand the proportion of debt from all angles. This ratio tells us about the proportion of long-term debt compared to capitalization.
Capitalization means the sum of long term debt and the shareholders’ equity. In the example section, we will understand how to calculate it.
#3 – Total Debt to Capitalization
Let’s look at the third most important ratio.
Capitalization Ratio = Total Debt / Capitalization
The only difference between the previous ratio and this one is the inclusion of short-term debt. This ratio will look at total debt and determine the proportion of total debt compared to capitalization.
Total debt means both long-term debt and short-term debt. And capitalization means, as usual, the debt plus equity. But in this case, the capitalization would also include short-term debt (that means capitalization = long term debt + short term debt + shareholders’ equity).
In the example section, we will see how to calculate this ratio.
Interpretation
If we consider the above three ratios, we would be able to understand how a company is doing in the long run.
But we need to use discrimination while judging the leverage of a company depending on the industry it operates in. A capital-intensive company with predictable cash flow usually has a higher debt ratio. For example, telecommunications, utilities, and pipelines companies are very capital intensive and have reasonably higher cash flows. Thus, the capitalization ratios for these companies are higher in normal scenarios.
In other cases, IT and retail companies are low on capital intensity and, thus, have lower ratios.
Investors should also think about the cash flows of the companies they want to invest in. They need to see whether these companies have sufficient net cash inflow to pay back the debt. If the companies have adequate cash flows, their capitalization ratio would be usually higher and vice versa. The investors should look at leverage ratio – interest-coverage ratio to understand this
Have a look at the ratio –
Interest-Coverage Ratio = EBIT / Interest Expense
EBIT means Earnings before interest and taxes. If we look at the Income Statement we would be able to look at EBIT right away. This measure is used to see whether the company has enough earnings to pay off its interest or not. Along with looking at debt ratios, the investors should look at the interest coverage ratio to determine whether the company has enough earnings to pay off its interest.
Along with looking at debt ratios and interest coverage ratio, investors should also look at the time to time, not only once or twice. For example, to get a clear picture of the company’s capitalization, the investors should look at the figures over time. Finally, they should also compare the capitalization and interest coverage ratios to the peer companies to better understand.
Also, look at EBIT vs. EBITDA.
Capitalization Ratio Example
Now let’s look at a couple of examples to understand this ratio in detail.
Example # 1
M Corporation has furnished some information at the year-end, and from the information below, we need to understand the capitalization ratio of M Corporation from the point of view of an investor –
| Details | In US $ |
|---|---|
| Shareholders’ Equity | 100,000 |
| Total Debt | 100,000 |
| Short term Debt: Long term Debt | 3:2 |
We have been given this information. Now we will find out three ratios that will help us understand this ratio of M Corporation.
Let’s start with the first ratio.
Debt-Equity Ratio = Total Debt / Shareholders’ Equity
Here, total debt is given, and we also know the shareholders’ equity.
So putting the value in the ratio, we would get Debt-Equity Ratio as –
| Details | In US $ |
|---|---|
| Shareholders’ Equity (A) | 100,000 |
| Total Debt (B) | 100,000 |
| Debt-Equity Ratio (B/A) | 1 |
From the Debt-Equity Ratio, we can conclude that this is a relatively good firm using its equity and debt equally to fund its operations and expansion.
Let’s look at the next ratio.
Capitalization Ratio = Long term Debt / Capitalization
We know the total debt, and the ratio between short-term and long-term debt is given.
Let’s calculate the long-term debt and short-term debt first.
| Details | In US $ |
|---|---|
| Total Debt | 100,000 |
| Short term Debt: Long term Debt | 3:2 |
| Long term Debt | 40,000 |
| Short term Debt | 60,000 |
Now, putting the value of Long term debt into ratio, we get –
| Details | In US $ |
|---|---|
| Shareholders’ Equity (1) | 100,000 |
| Long term Debt (2) | 40,000 |
| Capitalization (3=1+2) | 140,000 |
| Capitalization Ratio 1 (2/3) | 0.285 |
From the above ratio, we can conclude that the ratio of M corporations is lower. If this corporation is from the IT industry, it’s doing quite well. But if it’s from capital intensive industries like telecommunications, utilities, etc., M Corporation needs to improve their ratio.
Let’s look at the third ratio.
Capitalization Ratio = Total Debt / Capitalization
Here the value of capitalization would be different as we need to include total debt into the capitalization.
| Details | In US $ |
|---|---|
| Shareholders’ Equity (D) | 100,000 |
| Total Debt (E) | 100,000 |
| Capitalization (D+E) | 200,000 |
Let’s put the value into the ratio.
| Details | In US $ |
|---|---|
| Total Debt (G) | 100,000 |
| Capitalization (F) | 200,000 |
| Capitalization Ratio 2 (G/F) | 0.50 |
From the above ratio, we can conclude the same. If this corporation is from the IT industry, it’s doing quite well. But if it’s from capital intensive industries like telecommunications, utilities, etc., M Corporation needs to improve its capitalization ratio.
Example # 2
Company C has furnished the below information –
| Details | In US $ |
|---|---|
| Shareholders’ Equity | 300,000 |
| Total Debt | 200,000 |
| EBIT | 75,000 |
| Interest Expenses | 20,000 |
We need to calculate the capitalization ratio and the interest coverage ratio.
This example is important because we need to understand the role of interest coverage on the firm’s long-term goals as an investor. For example, if a firm can have enough cash to pay off the interest of its debt, then it would be in a good stance to advance; otherwise, the firm wouldn’t be able to make substantial improvements in its current standing.
Let’s Calculate the ratios.
As we have been given total debt and shareholders’ equity
Let’s calculate the capitalization.
| Details | In US $ |
|---|---|
| Shareholders’ Equity (1) | 300,000 |
| Total Debt (2) | 200,000 |
| Capitalization (1+2) | 500,000 |
Putting the value of total debt and capitalization into the ratio, we get –
| Details | In US $ |
|---|---|
| Total Debt (3) | 200,000 |
| Capitalization (4) | 500,000 |
| Capitalization Ratio 2 (3/4) | 0.40 |
Company C needs to improve its capitalization if it wants to succeed in the long run; however, it depends on what type of industry it is in.
Let’s calculate the interest coverage ratio now.
Interest-Coverage Ratio = EBIT / Interest Expense
Putting the value of EBIT and Interest Expense, we get –
| Details | In US $ |
|---|---|
| EBIT (5) | 75,000 |
| Interest Expense (4) | 20,000 |
| Interest-Coverage Ratio (5/4) | 3.75 |
In this case, the interest-coverage ratio is quite good. That means the firm has good standing in terms of income, even if the capitalization ratio is much lower. To understand the whole picture, we need to look at all the firm’s ratios and then decide whether investing in the firm is a good idea.
Nestle Example
Below snapshot is Consolidated balance sheet of Nestle as of 31st December 2014 & 2015

source: Nestle
From the table above –
- Current Portion of Debt = CHF 9,629 (2015) & CHF 8,810 (2014)
- Long Term Portion of Debt = CHF 11,601 (2015) & CHF 12,396 (2014)
- Total Debt = CHF 21,230 (2015) & CHF 21,206 (2014)
#1 – Debt to Equity Ratio
Debt to Equity Ratio = Total Debt / Total Equity
| In millions of CHF | 2015 | 2014 |
|---|---|---|
| Total Debt (1) | 21230 | 21206 |
| Total Equity (2) | 63986 | 71884 |
| Total Debt to Equity | 33.2% | 29.5% |
The Total Debt to Equity ratio has increased from 29.5% in 2014 to 33.2% in 2015.
#2 – Capitalization Ratio = Long Term Debt / Capitalization
| In millions of CHF | 2015 | 2014 |
|---|---|---|
| Long Term Debt | 11601 | 12396 |
| Total Debt | 21230 | 21206 |
| Total Equity | 63986 | 71884 |
| Total Debt and equity (Capitalization) (2) | 85216 | 93090 |
| Ratio | 13.6% | 13.3% |
The capitalization ratio had marginally increased from 13.3% in 2014 to 13.6% in 2015.
#3 – Capitalization Ratio = Total Debt / Capitalization
| In millions of CHF | 2015 | 2014 |
|---|---|---|
| Total Debt (1) | 21230 | 21206 |
| Total Equity | 63986 | 71884 |
| Total Debt and equity (Capitalization) (2) | 85216 | 93090 |
| Ratio | 24.9% | 22.8% |
The capitalization ratio had marginally increased from 22.8% in 2014 to 24.9% in 2015.
Analyzing Capitalization Ratio of Oil & Gas Companies (Exxon, Royal Dutch, BP & Chevron)
Below is the (Debt to Total Capital) graph of Exxon, Royal Dutch, BP, and Chevron.
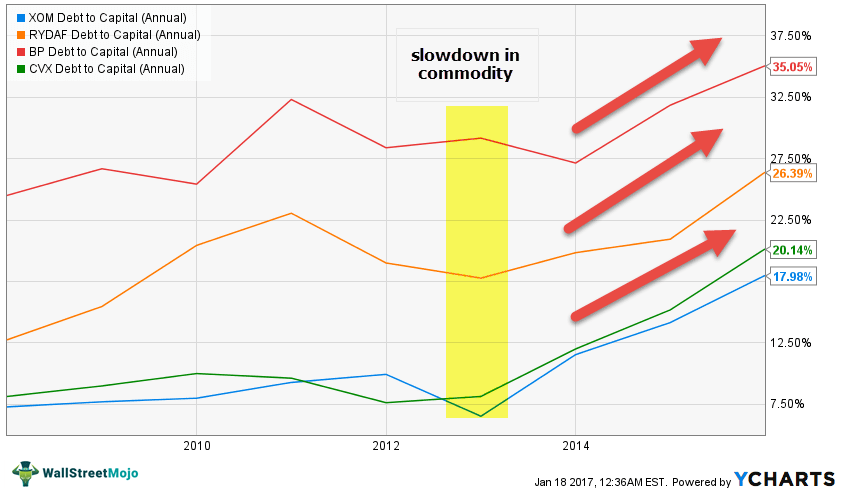
source: ycharts
We note that this ratio has increased for most Oil & Gas companies. This is primarily due to a slowdown in commodity (oil) prices, resulting in reduced cash flows, straining their balance sheet.
| Period | BP | Chevron | Royal Dutch | Exxon Mobil |
|---|---|---|---|---|
| 31-Dec-15 | 35.1% | 20.1% | 26.4% | 18.0% |
| 31-Dec-14 | 31.8% | 15.2% | 20.9% | 14.2% |
| 31-Dec-13 | 27.1% | 12.0% | 19.8% | 11.5% |
| 31-Dec-12 | 29.2% | 8.1% | 17.8% | 6.5% |
| 31-Dec-11 | 28.4% | 7.6% | 19.0% | 9.9% |
| 31-Dec-10 | 32.3% | 9.6% | 23.0% | 9.3% |
| 31-Dec-09 | 25.4% | 10.0% | 20.4% | 8.0% |
| 31-Dec-08 | 26.7% | 9.0% | 15.5% | 7.7% |
| 31-Dec-07 | 24.5% | 8.1% | 12.7% | 7.3% |
source: ycharts
Important points to note here are as follows –
- Exxon ratio increased from 6.5% to 18.0% in a 3 year period.
- BP ratio increased from 28.4% to 35.1% in a 3 year period.
- Chevron ratio increased from 8.1% to 20.1% in a 3 year period.
- The Royal Dutch ratio increased from 17.8% to 26.4% in a 3 year period.
Comparing Exxon with its peers, we note that the Exxon Capitalization ratio is the best. Exxon has remained resilient in this down cycle and generates strong cash flows because of its high-quality reserves and management execution.
Why Marriott International Capitalization Ratio Increased Drastically – A case study
Why do you think the Debt to Capital Ratio has increased drastically?

source: ycharts
To revisit, what is the formula of Debt to Capital Ratio = Total Debt / (Total Debt + Equity)
Did the company raise a disproportionate amount of debt?
The below image provides details of Marriott International Debt of 2014 and 2014. We note that debt has marginally increased. We cannot blame this marginal increase in debt for increasing the capitalization ratio.
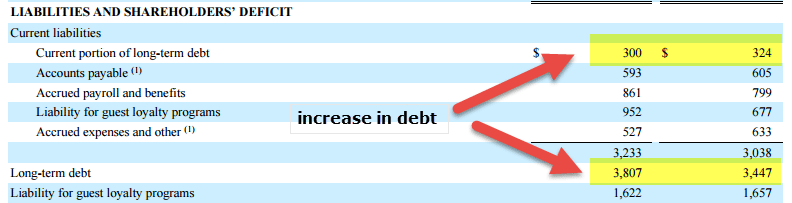
source: Marriott International SEC Filings
Is Shareholders Equity the answer?
Did Shareholder Equity decrease? YES, it did!
Do have a look at the snapshot below of Cash flow from Financing activities of Marriott International. We note that the company has been buying back shares. In 2015, Marriott International bought back $1.917 billion worth of treasury shares. Likewise, in 2014, it bought back $1.5 billion worth of treasury shares.

source: Marriott International SEC Filings
With this, Shareholder’s Equity reduced sharply, as seen in the balance sheet below.
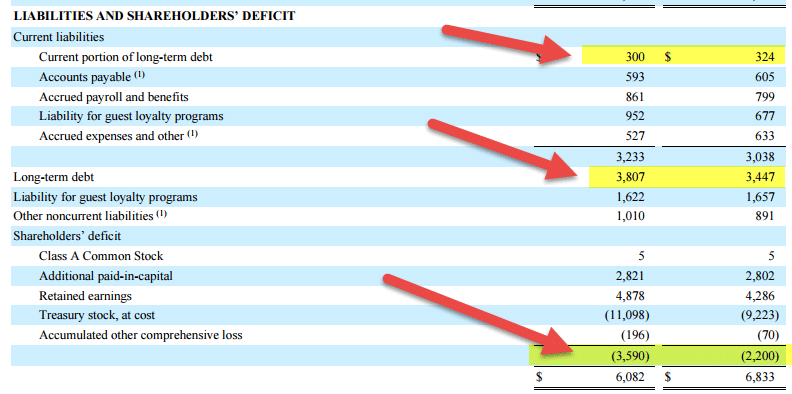
source: Marriott International SEC Filings
We note that Shareholder’s Equity was -$3.59 billion in 2015 and -2.2 billion in 2014.
Since this is a negative number, the total capital (Total Debt + Equity) reduces, increasing the capitalization ratio. (Simple!)
Recommended Articles
Conclusion
The capitalization ratio helps understand whether the firms have utilized their capital well. We can understand how a firm leverages its finances to create better opportunities through this ratio. But as we always say, only one or two ratios are not enough to create clarity within the mind of an investor. The investor needs to look at all the ratios and net cash inflow to get a big picture of the firm before actually investing in it.
Recommended Articles
Continue with these closely related articles from the same guide.