What Is Equity Multiplier?
The equity multiplier helps us understand how much of the company’s assets are financed by the shareholders’ equity and is a simple ratio of total assets to total equity. If this ratio is higher, then it means financial leverage (total debt to equity) is higher. And if the ratio turns out to be lower, the financial leverage is lower.
Thus, it shows the proportion of equity in the capital structure of the business. It identifies the sources of fund for the company and the extent of financial obligation in the form of debt. It is a very useful metric for both management and stakeholders who get an idea about the financial ability of the company to absorb risk.
- The Equity Multiplier is the proportion of a company’s assets financed by equity.
- It established the proportion between the total assets of a company and its equity financing. The formula for the same is Total Assets / Total Equity.
- If the equity multiplier is high, the company has very low leverage, and the owner is highly diluted. However, if the equity multiplier is low, the company is highly leveraged, and the risk is high.
- Equity Multiplier is very helpful in Dupont ROE Analysis. The Dupont ROE analysis uses various ratios to determine the return on equity.
Equity Multiplier Explained
The equity multiplier is a ratio that is commonly used to measure the proportion of equity financing in the capital structure of the business. In other words, it shows the proportion of shareholder’s equity as compared to debt in the financing the assets of the company.
Equity multiplier equation gives the stakeholders an idea about how the company has funded its assets. If the ratio is high, it would signify that the proportion of debt is higher as compared to equity and a lower ratio would indicate a higher proportion of equity. A higher part of debt indicates that the company is highly leveraged. The debt obligation and the pressure of loan repayment will eat away the earnings if the business is not strategically planned to manage its finances in an optimum way.
A higher equity financing gives the company a flexibility to raise capital from investors without the obligation to pay it back in full amount with interest. However, the investors will expect a return in the form of dividend.
The financial analysts, investors and management use this metric of equity multiplier ratio to evaluate the risk profile of the business. If the company is already doing well and is profitable, then leverage will provide benefit in the form of funds for further expansion. But during downturns, if the company is having a good customer base and has the history of consistent devidnd payment, it is a good idea to raise funds through equity.
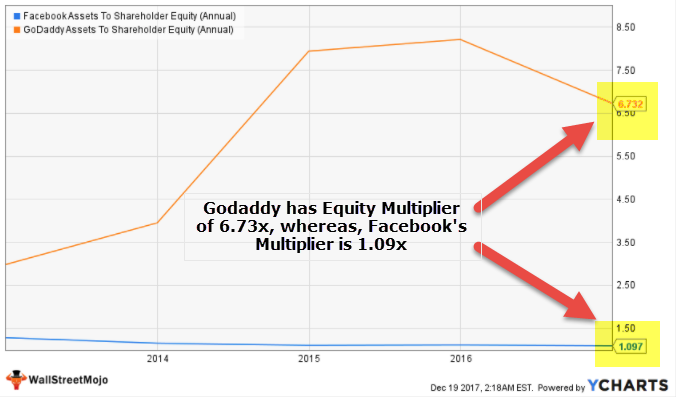
We note from the below graph that Go daddy has a higher multiplier at 6.73x, whereas Facebook’s Multiplier is lower at 1.09x.
Formula
Below is the formula or the equity multiplier equation–
Equity Multiplier = Total Assets / Total Equity

Along with finding out each unit of total assets for each unit of total equity, it also tells a lot about how much the company has financed its assets through external sources of finance, i.e., debt.
Let’s take an example to illustrate this.
Video Explanation of Equity Multiplier

Interpretation
As an investor, if you look at a company and its multiplier, you would only be able to tell whether the company has been using high or low financial leverage ratios.
However, to know whether the company is at risk or not, you need to do something else as well.
You need to pull out other similar companies in the same industry and calculate equity multiplier ratio.
If you see that the result is similar to the company you want to invest in, you would be able to understand that high or low financial leverage ratios are the norm of the industry.
That means if the company is financing its assets more by debt financing and the other companies in the industry have been doing the same, then this may be the norm.
But financing the assets through debt is still a very risky business. That’s why you need to go to the advanced calculation and look at the financial leverage ratios in detail.
Examples
Let us try to understand the concept of equity multiplier calculation with the help of some suitable examples.
Example #1
Let’s say that Company Z has total assets of $100,000. Its total equity is $20,000. Calculate equity multiplier.
This is a simple example, but after calculating this ratio, we would be able to know how much assets are financed by equity and how much assets are financed by debt.
Or, Multiplier = $100,000 / $20,000 = 5.
The multiplier is 5 means that total assets are financed by 20% of equity ($20,000/$100,000 * 100 = 20%) and the rest (i.e. 80%) is financed through debt.
This is an essential consideration since financial leverage would be higher/ lower depending on the equity multiplier calculation (whether the multiplier is higher or lower).
Let us now look at Multipliers of some sectors
Example #2
Let us look at the multiplier of some of the prominent Auto Manufacturer
| Name | Assets To Shareholder Equity |
|---|---|
| Ford Motor | 8.16x |
| Fiat Chrysler Automobiles | 5.44x |
| General Motors | 5.06x |
| Honda Motor Co | 2.60x |
| Ferrari | 11.85x |
| Toyota Motor | 2.78x |
| Tesla | 4.77x |
| Tata Motors | 4.99x |
- We note that the equity multiplier of Ferrari is highest at 11.85x, whereas, the Multiplier of Honda Motor Co is lowest in the group at 2.60x
- Overall we note that Multiplier is relatively higher for this sector
Example #3
Let us now look at the Multipliers for Internet Companies.
| Name | Assets To Shareholder Equity |
|---|---|
| Baidu | 1.97x |
| Care.com | 2.32x |
| 1.10x | |
| Phoenix New Media | 1.46x |
| GoDaddy | 6.73x |
| Alphabet | 1.20x |
| Groupon | 6.66x |
| GrubHub | 1.23x |
| JD.com | 4.73x |
| Snap | 1.30x |
| Shutterstock | 1.75x |
| 1.49x | |
| Yelp | 1.10x |
| Yandex | 1.48x |
We note that the biggies like Facebook (1.10x), Twitter (1.49x), and Alphabet (1.20x) have lower Equity Multipliers.
- GoDaddy has the highest Multiplier in this group at 6.73x.
- Yelp and Facebook have the lowest Multiplier in this group at 1.10x.
Example #4
Below is the list of Multipliers for Global Banks.
| Name | Assets To Shareholder Equity |
|---|---|
| Bank of America | 8.20x |
| Barclays | 18.70x |
| Bank of Montreal | 16.00x |
| Bank of Nova Scotia | 15.25x |
| Citigroup | 7.96x |
| Canadian Imperial Bank | 18.21x |
| Credit Suisse Group | 19.57x |
| East-West Bancorp | 10.15x |
| HSBC Holdings | 13.54x |
| ING Group | 17.82x |
| JPMorgan Chase | 9.80x |
| Mitsubishi UFJ Financial | 21.25x |
| Bank of N.T Butterfield | 15.62x |
| Royal Bank of Scotland | 16.43x |
| Royal Bank of Canada | 16.43x |
| Banco Santander | 14.73x |
| Sumitomo Mitsui Financial | 19.24x |
| The Toronto-Dominion Bank | 17.24x |
| UBS Group | 17.44x |
| Westpac Banking | 13.90x |
| Wells Fargo | 9.67x |
- Overall, we note that Global Banks have higher Assets To Shareholder Equity. In most cases, Multiplier is higher than 10x.
- JPMorgan has an equity multiplier of 9.80x, whereas, Citigroup has a multiplier of 7.96x (lowest in this group)
Example #5
Below is the list of Multiplier for Discount Stores.
| Name | Assets To Shareholder Equity |
|---|---|
| Big Lots | 2.47x |
| Costco Wholesale | 3.37x |
| Dollar General | 2.16x |
| Dollar Tree Stores | 2.91x |
| Fred’s | 2.07x |
| Ollie’s Bargain Outlet | 1.60x |
| Pricesmart | 1.66x |
| Target | 3.42x |
| Tuesday Morning | 1.80x |
| Wal-Mart Stores | 2.56x |
- Overall, the Equity Multiplier in this group ranges from 1.5x -3.5x
- Target has the highest Multiplier at 3.42x, whereas Ollie’s Bargain Outlet has the lowest at 1.60x
Example #6
Company Usher has total assets of $400,000. The total equity of this company is $50,000. Ramesh, an investor, wants to know the equity multiplier as well as the ROE under DuPont analysis to see whether he should invest in the company or not. That’s why he looks into the annual report of the company and finds out the following details –
- Net income for the year – $40,000
- Sales – $200,000
Find out the multiplier and ROE under DuPont analysis for Ramesh.
We will follow the equity multiplier formula and will put the data we have into the formula to find out the ratios.
First, let’s Calculate the equity multiplier.
Or, Assets To Shareholder Equity = $400,000 / $50,000 = 8.
That means the 1/8th (i.e., 12.5%) of total assets are financed by equity, and 7/8th (i.e., 87.5%) are by debt.
Now, let’s calculate the ROE under DuPont Formula analysis.
ROE under DuPont Analysis = Profit Margin * Assets Turnover Ratio * Equity Multiplier
Or, ROE under DuPont Analysis = Net Income / Sales * Sales / Total Assets * Total Assets / Total Equity
Or, ROE under DuPont Analysis = $40,000 / $200,000 * $200,000 / $400,000 * $400,000 / $50,000
Or, ROE under DuPont Analysis = 1/5 * ½ * 8 = 0.2 * 0.5 * 8 = 0.8.
Therefore, the above examples give us an obvious idea about the calculation of the metric, how to find the required data from the financial statements, and how to use the derived value for analysis and decision-making in business.
Extension To Dupont Analysis
Equity Multiplier is very helpful in Dupont ROE Analysis. Under DuPont analysis, we need to use three ratios to find out the return on equity.
One of the ratios under DuPont analysis is the Assets To Shareholder Equity ratio.
ROE = (Profit/Sales) x (Sales/Assets) x (Assets/Equity)
ROE = Net Profit Margin x Asset Turnover x Equity Multiplier
You may ask why one should calculate ROE under DuPont analysis
It is simple. In a good equity multiplier if the Assets To Shareholder Equity is higher, the ROE under DuPont analysis will also be higher.
And that’s how an investor will understand whether she will invest in the company or not, meaning she will get an advanced ratio to help her figure out whether she has come to the right conclusion by choosing / or not choosing to invest in the company.
Why should an investor depend on DuPont analysis after looking through multiplier?
This can be a big question in the investor’s mind.
The answer is threefold.
In Assets To Shareholder Equity, we get a sense of how financially leveraged a company is.
If the equity multiplier is higher, financial leverage is higher and vice versa.
But what if the investor isn’t convinced only with the financial leverage?
Then, he needs to look at other aspects of the equation, i.e., the company’s operational efficiency and efficiency of the utilization of assets.
By calculating the ROE under DuPont analysis, the investor gets a clear idea of how much operational efficiency the company has plus how much efficiency of the assets the company has achieved.
In the example above, along with the equity multiplier, we get an overview of operational efficiency (i.e., 20%) and efficiency of the utilization of the assets (i.e., 50%).
By looking at the whole picture, now an investor can decide whether to invest in the company or not.
Equity Multiplier Vs Debt Ratio
Both the above concepts refer to financial ratios that are widely used in the financial market to assess the capital structure in the form of proportion of debt and equity. However, both of them focus of different aspects and have different conclusions. Let us find the differences between them.
- A good equity multiplier focuses on measuring the portion of shareholder’s equity used to finance the business’s assets. In contrast, the latter focuses on financing the assets using debt or borrowed funds.
- The formula used to calculate the former is total assets divided by the shareholder’s equity, whereas the latter is calculated using the formula where the total debt is divided by the total assets.
- A higher value derived in case of the former indicates that the debt part in the capital structure is more than the equity and a higher value derived in case of the latter also indicates the same.
- Similarly in case of a lower value derived in both the cases will indicate that equity portion is higher compared to debt .
- Even though both the metrics identify the proportion of debt and equity in the company’s assets, the former is commonly used to understand how much the company is relying on equity to finance its assets, whereas the latter is commonly used to understand how much risk the company is taking in terms of debt financing.
Thus, both are widely used ratio analysis. However, the key difference lies on what they focus on. But still, in order to evaluate the financial health of the business, it is always a good idea to use them in conjunction r combination with other ratios and measures. This will give a more thorough a clear financial analysis that is useful in making decisions for both stakeholders and the management.
Frequently Asked Questions (FAQs)
What is the formula of Equity Multiplier?
The formula for calculating Equity Multiplier is Total Assets / Total Equity. It entails the proportion of equity financing with a company’s assets.
How can Equity Multiplier be interpreted?
A high Equity Multiplier entails that the firm isn’t highly leveraged and the ownership is highly diluted. If an equity multiplier is low, it implies that the company is highly leveraged, increasing the investment risk.
What are the trends of Equity Multiplier in various industries?
Automobile manufacturers are known to have a stable equity multiplier with an average of around 6x. Internet and content companies and discount stores feature a low equity multiplier, implying that the industry relies on debt. Global Banks feature a high multiplier, implying that the industry relies highly on debt.
Recommended Articles
This has been a guide to what is Equity Multiplier. We explain the formula and its interpretation along with examples & differences with debt ratio. You may have a look at the below readings to enhance your knowledge on Ratio Analysis –