Table Of Contents
What Is The Financial Modeling Process?
The financial modeling process is a step-by-step approach that starts with populating the historical financial data in an excel sheet, performing financial analysis, making assumptions and forecasting, and finally assessing risk by performing sensitivity analysis and stress testing.
Keeping the expenses and earnings properly arranged in the spreadsheet helps firms and their professional get a clear picture of the cash going out and moving in the business. As a result, making a decision and tracking the effect of that decision on the business become much easier.
Key Takeaways
- The financial modeling process follows a systematic approach, commencing with inputting historical financial data into an Excel sheet.
- Subsequently, it involves economic analysis, assumption formulation, and forecasting and concludes with sensitivity analysis and stress testing to assess risk.
- The process entails seven sequential steps: entering historical financial data, assessing past performance,
- gathering assumptions for future forecasts, evaluating potential risks to the organization, conducting sensitivity analysis, and finally, stress testing the predictions.
- It's crucial to recognize that assumptions significantly impact predictions. Analysts should delve into the patterns and underlying causes after identifying them to comprehend better the dynamics influencing the outcomes.
Financial Modeling Process Explained
The financial modeling process helps keeping the businesses’ earnings and expenses figures clearly readable. Based on the same, the financial performance is assessed, and companies can predict the stock value and its performance in accordance with the same.
The spreadsheet not only allows the executives keep track of the inflow and outflows but also serves to be the informative data leading to decision-making. The implementations of today can be assessed, depending on various parameters, in future for results. If the strategies adopted by the businesses seem to work, they continue with the same. Else, they get an idea that they need to change strategies to improve figures.
In addition, these figures help in the valuation of the firms and also allow them to have a clear comparison with the competitors in the market. However, to make this modeling process effective, it is important to follow few steps in a proper sequence.
Process Steps
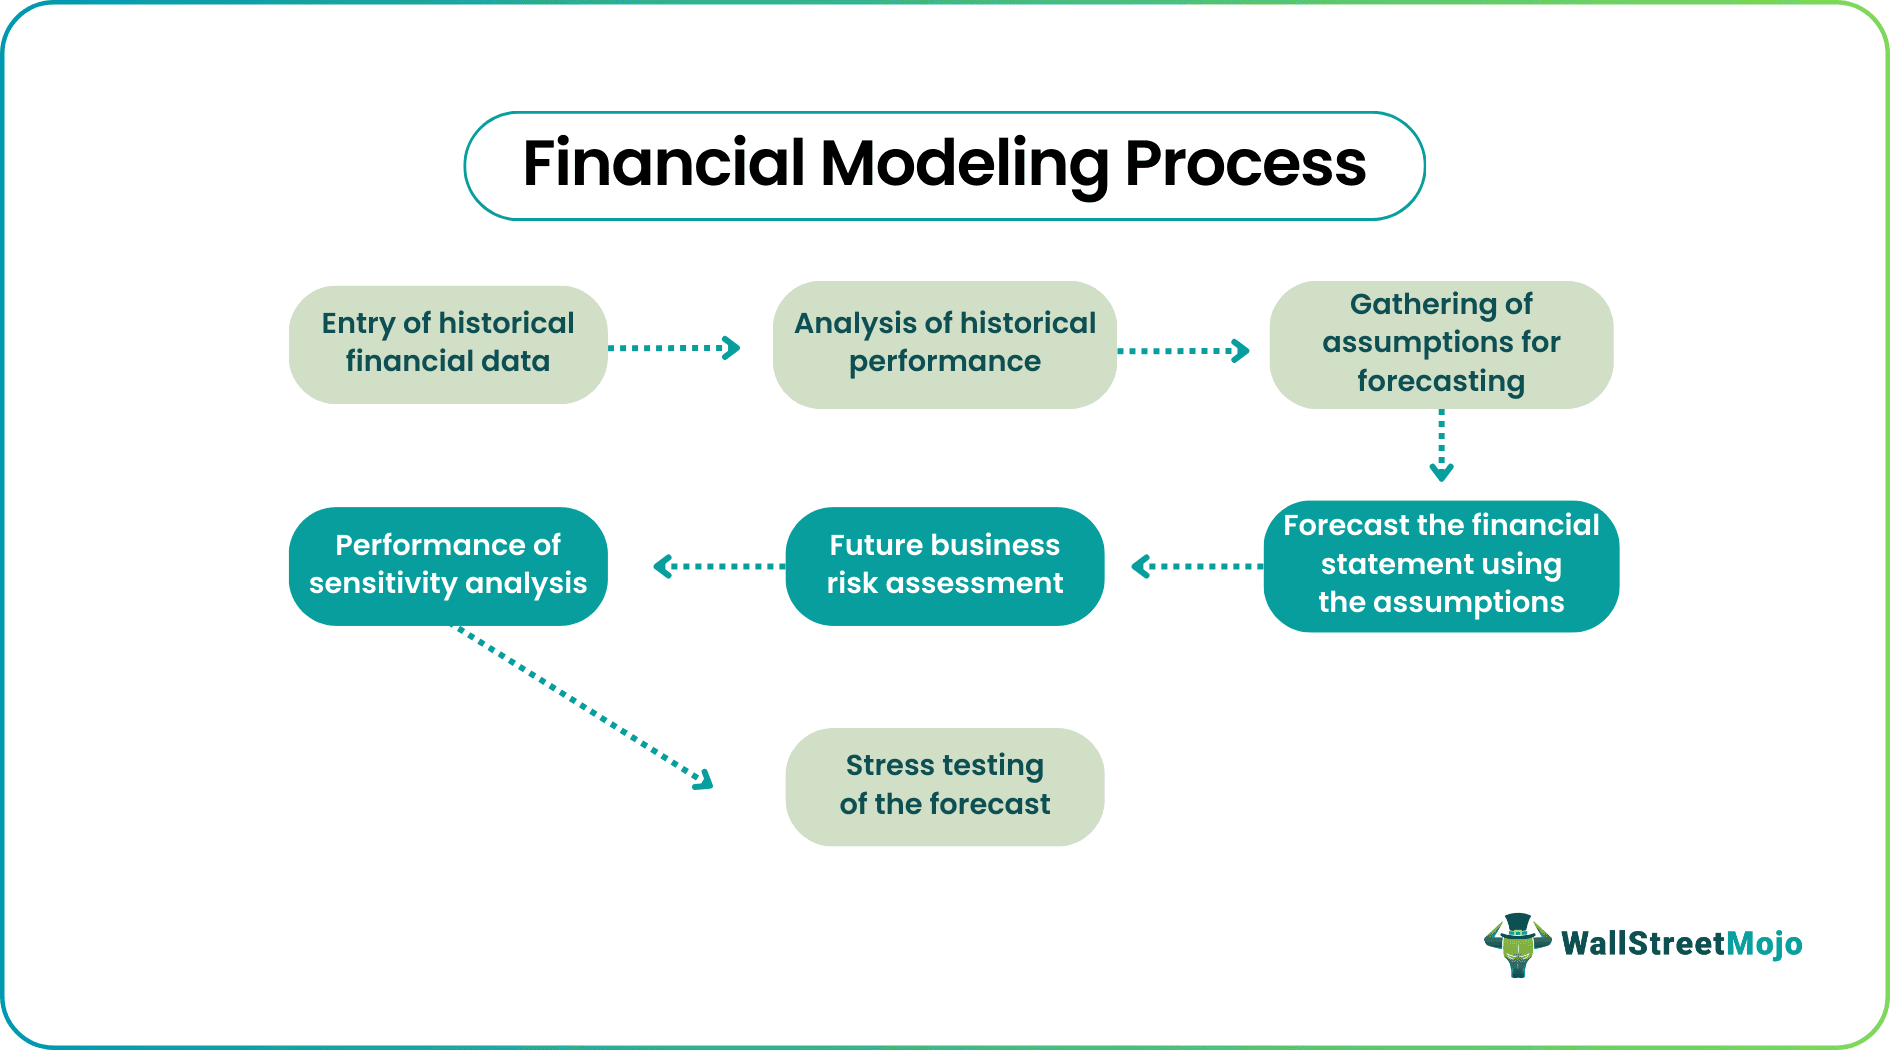
The financial modeling process involves the following steps to ensure effectiveness. Let us look into these steps in details below:
- The entry of Historical Financial Data
- Analysis of Historical Performance
- Gathering of Assumptions for Forecasting
- Forecast the Three Statement Model
- Future Business Risk Assessment
- Performance of Sensitivity Analysis
- Stress Testing of the Forecast
#1 - Entry of Historical Financial Data
Any financial model starts with the entry of historical financial statements. The analyst then inputs the historical information into an excel spreadsheet, which marks the start of financial modeling. Generally, analysts prefer the latest 3 to 5 years of historical data as it provides a fair bit of insight into the company's business trend in the recent past. The analyst should be cautious while capturing the historical data from the three financial statements and the corresponding schedules. Any mistake in this step can potentially deteriorate the quality of the end model.
#2 - Analysis of Historical Performance
In this step, the analyst must apply all their knowledge of accounting and finance. Each line item of the historical income statement, balance sheet and cash flow statement should be analyzed to draw meaningful insights and identify trends. For instance, growing revenue, declining profitability, deteriorating capital structure etc.
It is important to note that this analysis will strongly influence the assumptions for forecasting. Once the trend has been identified, the analyst should try and understand the underlying factors driving the trend. For instance, the revenue has been growing due to volume growth; the profitability has been declining in the last three years owing to a surge in raw material prices; capital structure has deteriorated on the back of debt-laden capex plan etc.
#3 - Gathering of Assumptions for Forecasting
Next, the analyst has to build the assumptions for the forecast. The first method to draw assumptions is using the available historical information and their trends to project future performance. For instance, forecast the revenue growth as an average of the historical revenue growth in the last three years, project the gross margin as an average of the historical period, etc. This method is useful in the case of stable companies.
On the other hand, some analysts prefer to use forecast assumptions based on the current market scenario. This approach is more relevant in the case of companies operating in a cyclical industry, or the entity has a limited track record. Nevertheless, the assumptions for some of the line items in the balance sheet, such as debt and CAPEX, should be drawn from the guidance provided by the company to build a reliable model.
#4 - Forecast the Financial Statements using the Assumptions
Once the assumption is decided, it is time to build the future income statement and balance sheet based on the assumptions. After that, the cash flow statement is linked to the income statement and balance sheet to capture the cash movement in the forecasted period. At the end of this step, there are two basic checks –
- The value of the total asset should match with the summation of total liabilities and shareholder’s equity
- The cash balance at the end of the cash flow statement should be equal to the cash balance in the balance sheet
#5 - Future Business Risk Assessment
Next, the analyst should create a summary of the output of the final financial model. The output is usually customized as per the requirement of the end-user. Nevertheless, the analyst must provide their opinion on how the business is expected to behave in the upcoming years based on the financial model. For instance, the analyst can comment that the company will be able to grow sustainably and service its debt obligations without any real risks in the near to medium term.
#6 - Performance of Sensitivity Analysis
This step aims to determine at what point the performance of the company will start to decline and to what extent. In this step, the analyst must build scenarios into the model to perform sensitivity analysis. In other words, the resilience of the business model will be tested based on scenarios. This step is beneficial as it helps assess variation in performance in case of an unanticipated event.
#7 - Stress Testing of the Forecast
Here the analyst assumes the worst-case (extreme) scenario based on some unfortunate event during a specific period, say a decade. For instance, the recession of 2008-09 is used for stress testing the forecasting models of US-based companies. This step is also crucial as it helps understand how a company will behave in such an extreme scenario and whether it can sustain itself.
If you want to develop a practical understanding of the process, enrolling in the Financial Modeling 2-Day Bootcamp is worth considering. Through this boot camp, you will learn financial modeling in Excel from scratch from an industry expert with 20+ years of experience in training students from different parts of the world.
Financial Modeling Components
The process comprises 4 key components. Let us look at the following pointers to understand them.
- Assumptions: This process is based on some key assumptions, which serve as educated projections concerning future conditions. These assumptions help in simulating various scenarios.
- Historical Data: Past data serves as the bedrock for financial models by providing insights into historical performance and assisting in the identification of patterns and trends.
- Supporting Schedules: Besides the primary financial statements, supporting schedules offer comprehensive breakdowns of certain components, improving the granularity of a financial model.
- Financial Statements: The financial statements refer to the balance sheet, cash flow statement, and income statement of a company. They provide a clear idea of a company’s financial health.
This process is useful across different businesses and industries. Some of the common users are as follows:
- Startups: New businesses create financial models to make informed decisions and secure funds from investors. They also use the models to create plans that can boost growth.
- Consulting Firms: These organizations create financial models and use them to give clients insights into financial health and market trends.
- Investment Banks: An investment bank utilizes this process to determine the value of companies, support investment decisions, and evaluate mergers and acquisitions.
- Private Equity Firms: These firms utilize financial modeling to value potential investments, optimize portfolio performance, and carry out due diligence.
- Corporations: This process helps corporations in assessing investment opportunities, budgeting, and strategic planning.
Example
Let us consider the following instance to understand the concept better:
Company A, given its consistent growth from a start-up to a full-fledged business in a couple of years, decides to track its sales growth and also compare itself with its own performance every year. Hence, it decides to follow a financial modeling process.
To achieve this, it lists down how to segregate the cells in the spreadsheet. It dedicates cell A to record the sales figures of the previous year, cell B for the sales figures of the current year, and cell C to find the average sales with respect to the sales figures A and B.
For cell C to work, the company professionals incorporate a formula – (A-B)/A. Hence, for every value of cell C, the spreadsheet carries out the respective average calculation. When the entries were made, company A observed an increase in its figures and hence it decided to go public given the progress it has been making over the past few years. This format becomes a standard one for the company and is likely to help it record the figures every year, enabling them to study the drop or rise in the sales figures.
Financial Modeling Best Practices
Let us understand the financial modeling best practices by going through the following points:
- Consistent Formatting: Individuals must make sure to keep the formatting consistent to enhance readability. This practice involves using standardized layouts, fonts, and colors.
- Sensitivity Analysis: One should carry out this type of analysis to evaluate the sensitivity of a model to the alterations in the main assumptions.
- Documentation: It is crucial to document all assumptions, methodologies, and formulas carefully. It helps in maintaining transparency and is also vital for future reference.
- Model Validation: Individuals must validate the model on a regular basis by carrying out a comparison of the outputs with the actual financial results. It helps in spotting discrepancies and plays a key role in ensuring the accuracy of the model.
- Scenario Planning: Incorporating scenario planning can help in evaluating the effect that the different variables have on the outcomes. This helps in managing risk and taking better strategic decisions.
- Simplicity: Keeping the financial model straightforward and clear plays a vital role in improving understandability. One should take different measures to steer clear of unnecessary complexity.
- User-Friendly: Individuals should design the financial model with an interface that is easy to use. Otherwise, some stakeholders might not be able to use the model easily.
- Version Control: Note that it is necessary to use version control. This will help one monitor the alterations made to the financial model. Moreover, it will enable individuals to revert to earlier versions if required.
Importance
Following this financial modeling process step-by-step and then preparing a spreadsheet is, of course, a time consuming affair, but once the standard format is prepared, entering, organizing, and managing data becomes easier. However, there are financial modeling templates available to save one’s time. It offers an in-built format to store, and use data from.
No matter which format one uses, manual or system-built, the organized data is of great importance. Let us have a quick look at some of them below:
- It helps give a clear picture of expenses and earnings a business has.
- Knowing the difference helps businesses assess the real position of the business. In turn, the firms also know how the stock performance would be.
- The figures become a ready reference for investors, who many have a look at it to decide whether making investments in the assets would be fruitful.
- The businesses, through this spreadsheet or template information, get to know how effective the strategies implemented for business growth have been. If they are found working well, the firms continue with the same. Else, they modify the strategies for better results.
- As the businesses learn about the expenses, they may make smart asset allocation and cost management decisions, accordingly.