Part of our Capital Budgeting guide
What Is Sensitivity Analysis?
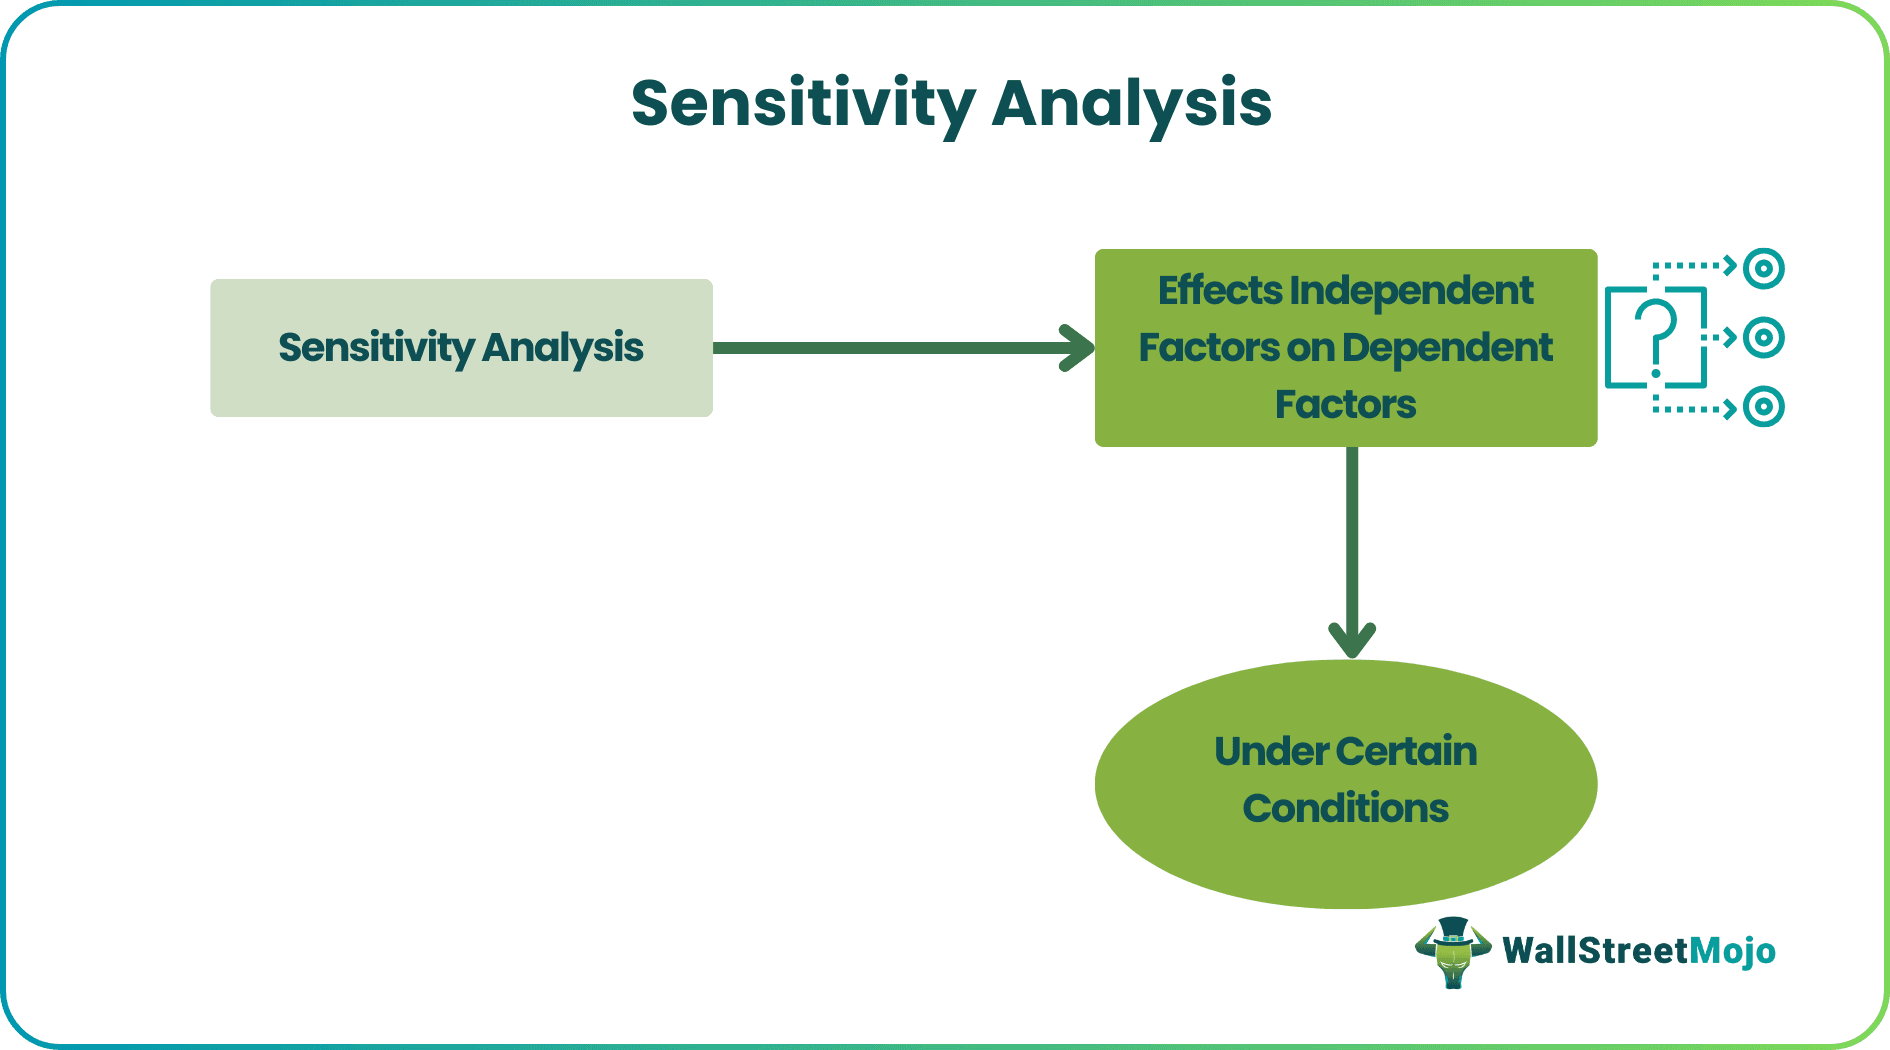
Sensitivity analysis is an analysis technique that works on the basis of what-if analysis like how independent factors can affect the dependent factor and is used to predict the outcome when analysis is performed under certain conditions.
It is commonly used by investors who take into consideration the conditions that affect their potential investment to test, predict and evaluate results. There are different methods that help conduct this analysis to provide conclusions as accurate and reliable as possible.
Sensitivity Analysis Explained
Sensitivity analysis, as the name suggests, observes how sensitive a dependent variable is to the changes in the value of the independent variables being used in the process. Conducting this analysis helps users determine how the uncertainty of an independent variable makes a financial model subject to a certain level of uncertainty.
It is similar to the what-if approach where analysts learn about what would happen to a model or assumption if the scenario changes. This technique is widely used by analysts in the financial industry as they get to determine or assess how the financial models would perform when the independent variables are sensitive to fluctuations and likely to cause the dependent variable to change with respect to the same.
Types
Sensitivity analysis can be of two forms – local and global sensitivity analyses.
#1 – Local Sensitivity Analysis
The local method, as the name suggests, includes obtaining data from one single point. It is based on derivatives, which can either be numerical or analytical. takes into consideration one parameter at a time to study its effect on the entire process. In the process, the rest of the parameters or variables are kept constant.
This method is suitable when the analysis is conducted to serve simple purposes, like cost functions, etc. However, it is not recommended for complex models as the derivatives are local and may not represent an ideal dataset.
#2 – Global Sensitivity Analysis
Global analysis, on the other hand, is the method that considers a wide array of datasets from different points to analyze the data on q wider space. It uses Monte Carlo techniques, along with other methods as well that have been listed as follows:
- Differential sensitivity analysis: It is a direct method where the independent variable’s coefficient is calculated from the dependent variable’s partial derivative. The calculation is done with respect to the independent variables. Though this method is good to go, solving complex equations becomes difficult.
- Factorial analysis: This method involves selecting samples based on specific parameters and then figuring out combinations. The resultant is used for further parameter analysis.
Formula
The formula for sensitivity analysis is basically a financial model in excel where the analyst is required to identify the key variables for the output formula and then assess the output based on different combinations of the independent variables.
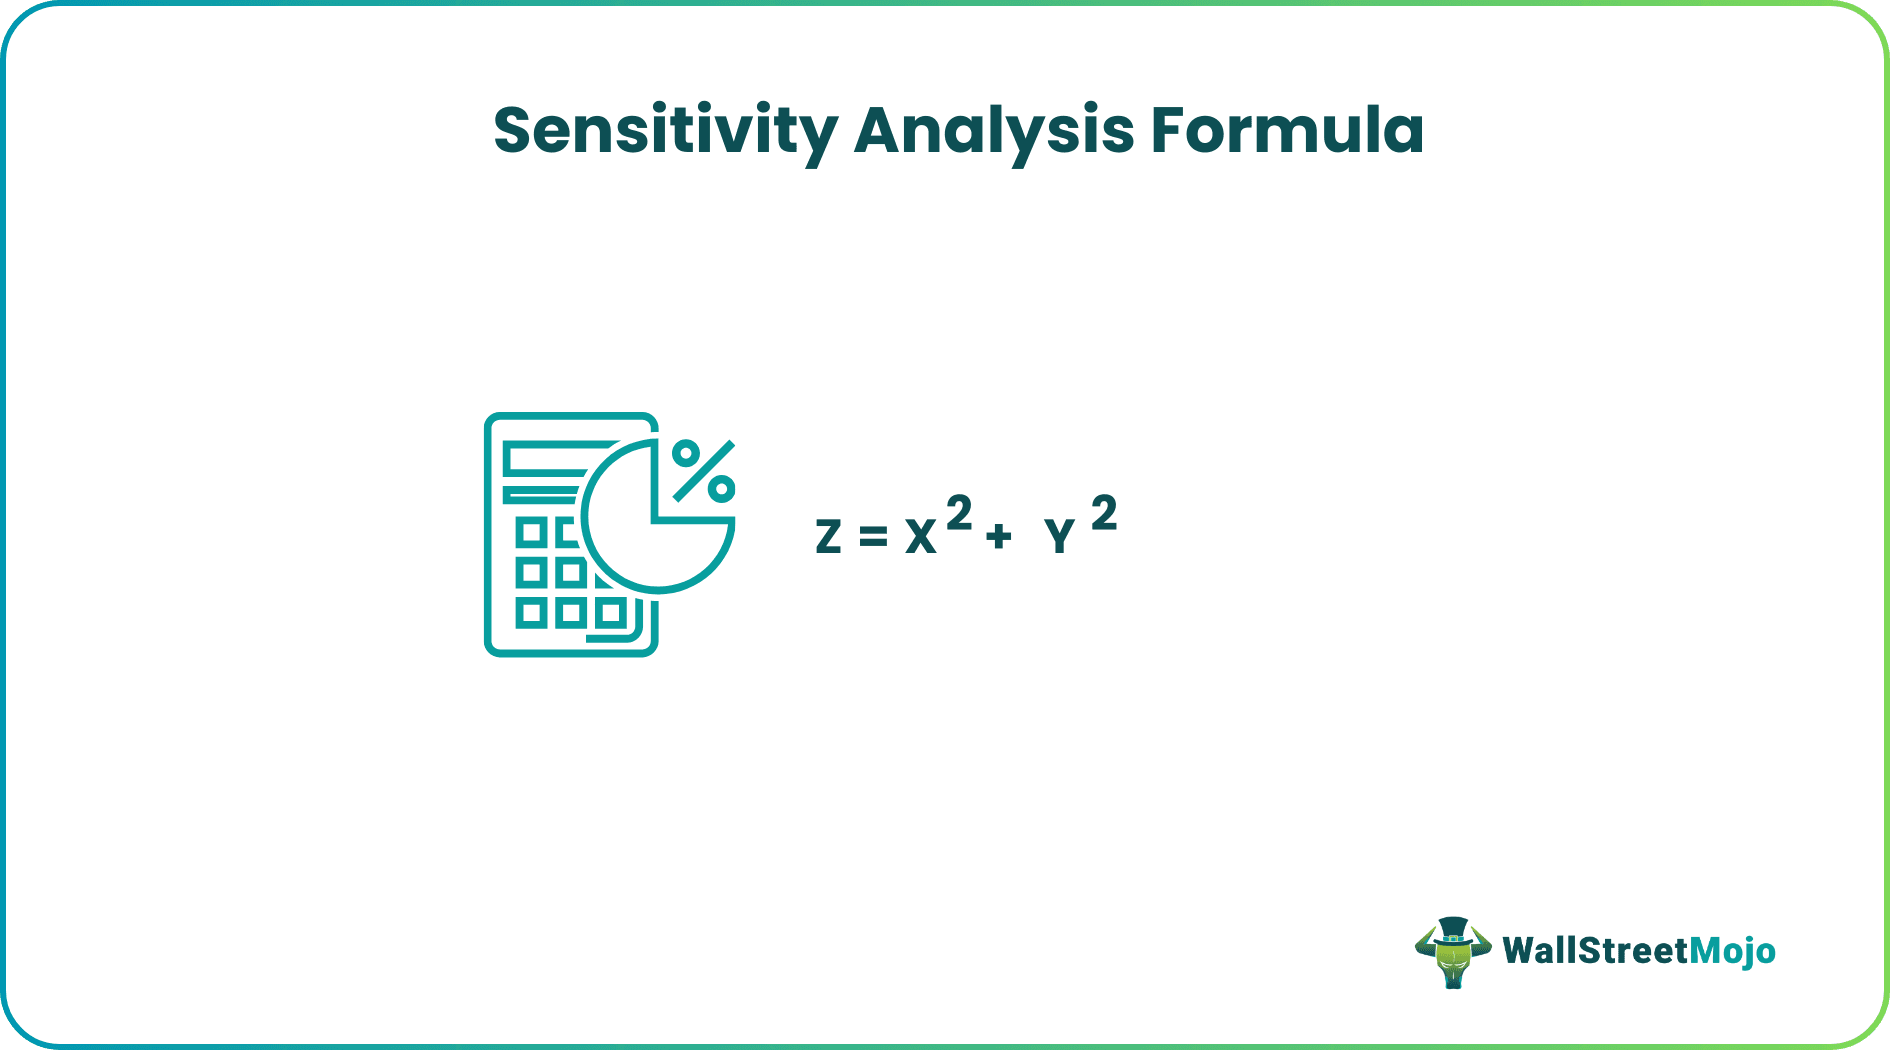
Mathematically, the dependent output formula is represented as,
Z = X2 + Y2
How To Do?
There is a series of sensitivity analysis methods that one must be aware of before conducting it. Knowing this helps users deploy the required measures wisely to obtain more reliable results. Let us have a look at the step-by-step process:
- Firstly, the analyst is required to design the basic formula, which will act as the output formula. For instance, say NPV formula can be taken as the output formula.
- Next, the analyst needs to identify which are the variables that are required to be sensitized as they are key to the output formula. In the NPV formula in excel, the cost of capital and the initial investment can be the independent variables.
- Next, determine the probable range of the independent variables.
- Next, open an excel sheet and then put the range of one of the independent variable along the rows and the other set along with the columns.
- Range of 1st independent variable
- Range of 2nd independent variable
Examples
Let us consider the following examples to check how to do sensitivity analysis in Excel on the data provided:
Example #1
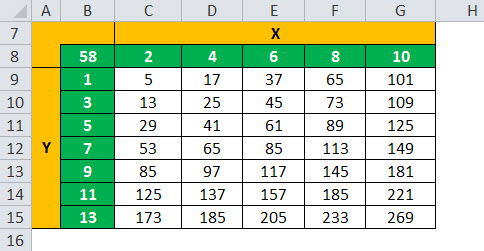
Let us take the example of a simple output formula, which is stated as the summation of the square of two independent variables X and Y.
In this case, let us assume the range of X as 2, 4, 6, 8, and 10, while that of Y as 1, 3, 5, 7, 9, 11, and 13. Based on the above-mentioned technique, all the combinations of the two independent variables will be calculated to assess the sensitivity of the output.

For instance, if X = 3 (Cell B2) and Y = 7 (Cell B3), then Z = 32 + 72 = 58 (Cell B4)

Z = 58
For the calculation of Sensitivity Analysis, go to the Data tab in excel and then select What if analysis option. For the further procedure of sensitivity analysis calculation, refer to the given article here – Two-Variable Data Table in Excel
Example #2
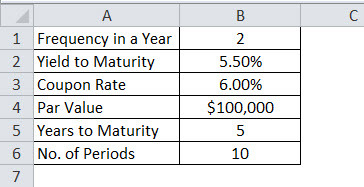
Let us take another example of bond pricing where the analyst has identified the coupon rate and the yield to maturity as the independent variables, and the dependent output formula is the bond price. The coupon is paid half-yearly with a par value of $1,000, and the bond is expected to mature in five years. Determine the sensitivity of the bond price for different values of coupon rate and yield to maturity.
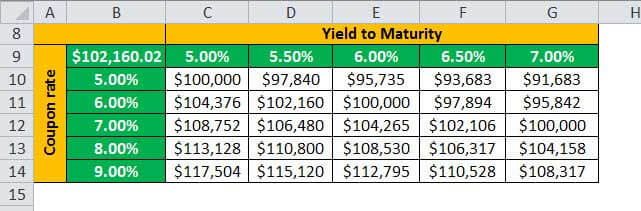
In this case, the analyst has taken the range of coupon rate as 5.00%, 5.50%, 6.00%, 6.50%, and 7.00%, while that of coupon rate as 5%, 6%, 7%, 8%, and 9%. Based on the above-mentioned technique, all the combinations of yield to maturity and coupon rate are taken to calculate the sensitivity of the bond price.
Therefore, the calculation of Bond Price is as follows.
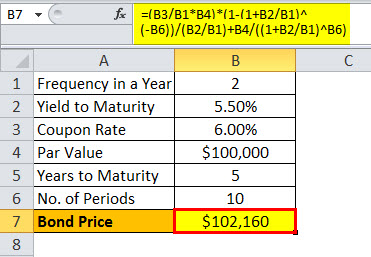
Bond Price =$102,160
For the calculation of Sensitivity Analysis, go to the Data tab in excel and then select What if analysis option.
Advantages & Disadvantages
It is vital to learn about the pros and cons of the process to understand the sensitivity analysis meaning better. For investors and financial analysts, it is significant to explore the positives and negatives of this analysis so that they can decide on its use further:
| Advantages | Disadvantages |
| It is an in-depth analysis where users get a chance to analyse each and every variable individually. | It is an assumption-based analysis. |
| When the study is deep, the users learn about the weak points and therefore, they prepare themselves even for the worst situations. | It considers each variable individually for outcomes. But in reality, the variables are inter-related and cannot stand alone. |
| Investment decisions are wisely made after a thorough analysis. | |
| Allocation of resources is done better when the strengths and weaknesses are identified. |
Importance
A sensitivity analysis is a technique which uses data table and is one of the powerful excel tools which lets a financial user understand the result of the financial model under various conditions. It can also be seen as the perfect complement to another excel tool, which is known as the scenario manager, and as such, it adds more flexibility to the valuation model during the process of analysis and, finally, in case of the presentation.
As such, it is very important for an analyst to appreciate the method of creation of a data table and then interpret its results to ensure that the analysis is heading in the desired direction. Further, a data table can be an effective and efficient way for presentation to the boss or client when it comes to expected financial performance under different circumstances.
Recommended Articles
Continue with these closely related articles from the same guide.