What is Gross Margin Formula?
The gross margin derives by deducting the cost of goods sold (COGS) from the net revenue or net sales (gross sales reduced by discounts, returns, and price adjustments). When the result is divided by revenue, we can determine the gross profit percentage. In simple terms, it is the amount of money a company has with them after deducting all of their direct production costs.
Using a gross margin formula calculator helps an organization to understand their production costs and basic financial health derived through their core activities in percentage format. A high gross margin indicates that the company might be able to retain more capital. It is also often referred to as gross profit margin.
- The gross margin is obtained by writing off the cost of goods sold (COGS) from the net revenue or net sales (gross sales reduced by discounts, returns, and price adjustments).
- It is an essential barometer of the entity’s ability to profit from core operations. The gross profit margin only includes operating revenue and expenses. Therefore, the company’s fundamental strength is observed by this ratio.
- It is the operating revenue and expenses. These two heads are essential to the business and aid the management in managing the production and sales division’s production performance.
Key Takeaways
- The gross margin is obtained by writing off the cost of goods sold (COGS) from the net revenue or net sales (gross sales reduced by discounts, returns, and price adjustments).
- It is an essential barometer of the entity’s ability to profit from core operations. The gross profit margin only includes operating revenue and expenses. Therefore, the company’s fundamental strength is observed by this ratio.
- It is the operating revenue and expenses. These two heads are essential to the business and aid the management in managing the production and sales division’s production performance.
Gross Margin Formula Explained
Gross margin is the percentage of profits an organization is able to retain after all deducting all direct expenses relating to production. To understand the sales gross margin formula, it is important to understand a few other concepts around it such as gross sales, cost of goods sold, and net sales. Let us discuss them in detail through the discussion below.
- Gross Sales: Revenue or sales is the amount fetched by the company after selling its services or goods. Generally, all the major companies follow the accrual method of accounting as prescribed by GAAP (Generally Accepted Accounting Principle).
- In the accrual system, one may record revenue or expenses as and when they occur, irrespective of whether they receive cash. The total receipt from selling the goods or services is gross revenue.
- Net Sales: For arriving at the net sales figure, a few items of price adjustments, deductions, and returns need to be separated from the gross revenue. The formula for net sales is as follows: –
Net Sales = Gross Sales – (Refunds + Price Adjustments + Price Deductions)
- Cost of Goods Sold: The direct costs such as raw material and labor for the units of goods sold, are considered COGS (Cost of Goods Sold). Here, we do not include indirect costs such as selling and administration expenses.
- The remaining goods are known as inventory, whether in a finished or unfinished condition. So, we take opening inventory So, we take opening inventory (closing inventory of the previous year), add purchases and other direct expenses, and deduct the closing inventory (stock of unsold products). It is calculated as follows: –
COGS = Opening Inventory + Purchases – Closing Inventory
Formula
The calculation of gross margin can be calculated both un absolute terms or in percentage format.
The formula of gross margin formula calculator in numbers and percentage terms can be calculated through the below formulae: –
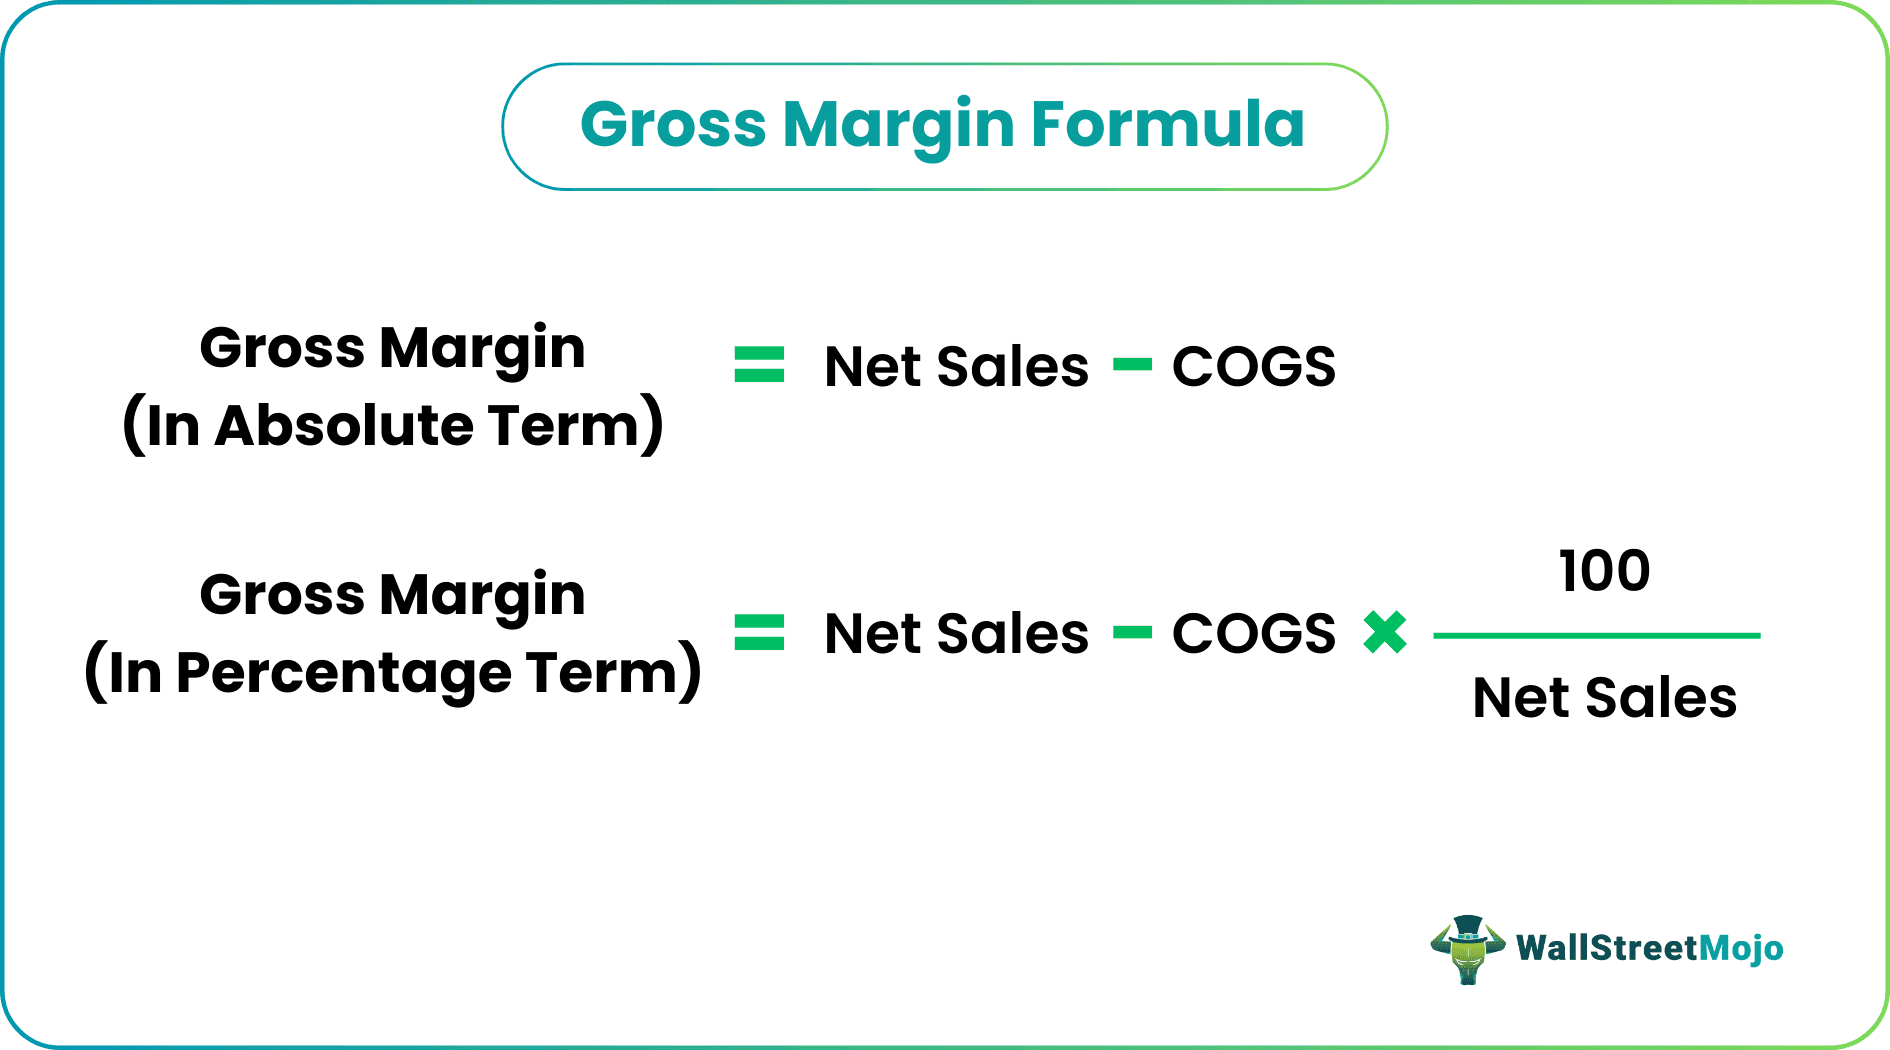
Gross Margin Formula (In Absolute Term) = Net Sales – COGS
Gross Margin Formula (In Percentage Form) = (Net Sales – COGS) * 100 / Net Sales
How To Calculate?
One can do the calculation of the gross margin equation by using the following steps:
- Firstly, we would calculate the net sales by deducting returns, discounts, and other adjustments in the sales amount.
- Then, the Cost Of Goods Sold (COGS) would derive by adding all the purchases, direct cost (labor and material), opening inventory, and subtracting the closing inventory.
- Now, we could calculate the gross margin by reducing COGS from net sales.
- To arrive at the gross margin percentage, we need to divide the gross margin (calculated above) by the net sales.
Examples
Let us discuss some simple to advanced models of the sales gross margin formula to understand the concept better.
Example #1
As of September 28, 2019, Apple Inc. has sold products and services worth $213,833 million and $46,291 million. The cost of goods sold includes the price allocated to products and services amounting to $144,996 million and $16,786 million each. Now, let us find out the gross margin and gross margin percentage.
Solution:
Use the below-given data for the calculation of gross margin: –
Calculation of gross margin can be done as follows: –
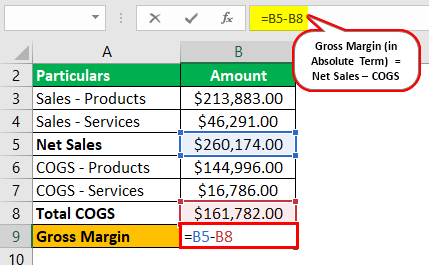
Gross margin = $260174 – $161782
The gross margin will be: –

Gross Margin = $98,392
Calculation of gross margin % can be done as follows: –
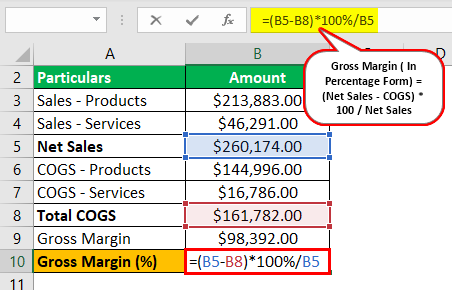
Gross margin (%) = ($260174 – $161782) * 100% / $260174
The gross margin (%) will be: –
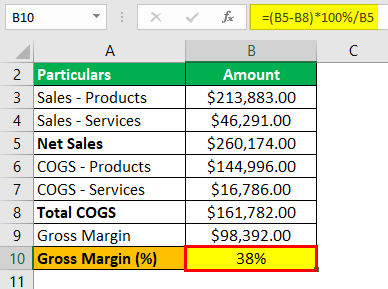
Gross Margin (%) = 38%
The gross margin equation expresses the percentage of gross profit; the company earns from $1 of sales. In the above case, Apple Inc. has reached a gross margin of $98,392 and 38% in percentage form. This 38% gross margin indicates that out of $1 of revenue from net sales, Apple Inc. can make a gross profit of 0.38 cents.
Example #2
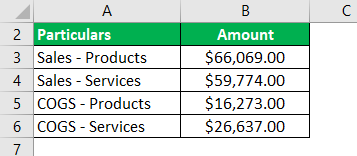
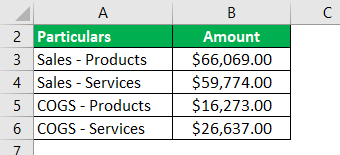
For the year ended June 30, Microsoft Inc. had revenue from products and services and another department of $66,069 million and $59,774 million, respectively. Also, in the same period, the cost of revenue for products and services and another dept. is $16273 million and $26,637 million, respectively. Therefore, we will try calculating the gross profit margin from the data above.
Solution:
Use the below-given data for the calculation of gross margin: –
Calculation of gross margin in Excel can be done as follows: –

Gross Margin = $125843 – $42910
Gross Margin will be –
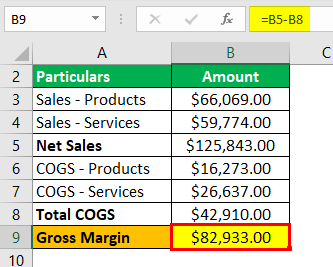
Gross Margin = $82,933.
Calculation of gross margin (%) can be done as follows:
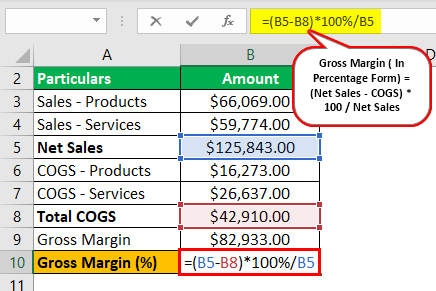
Gross Margin (%) = ($125843 – $42910) * 100 % / $125843
Gross Margin (%) will be: –

Gross Margin (%) = 66%
As we can see, Microsoft Inc. has clocked the gross margin to $82,933 million and 66% in percentage. As Microsoft Inc. and Apple Inc. are in similar fields, we would be able to compare these companies. Apple Inc. has a gross margin of $98,392 million. At the same time, Microsoft Inc. has earned only $82,933 million in the absolute term. But, regarding the percentage figures, Microsoft Inc. has a superior margin at 66% compared to 38% of Apple Inc.
Importance
The gross margin formula calculator is important in evaluating the company for various purposes. A few of the most significant ones are as discussed below:
- It is an important indicator of the entity’s ability to clock profits from its core operations. The gross profit margin only includes the operating revenue and expenses. Hence, the company’s fundamental strength is observed by this ratio. The higher ratio reflects the robust strength of the company to make profits.
- The main constituents of the gross margin ratio are the operating revenue and expenses. These two heads are vital to the business and help the management to oversee the performance of the production and sales division.
- If the gross margin ratio falls, the unproductive department could be easily tracked down and worked upon. One could take multiple measures to increase the productivity of that particular department. On the other hand, if the revenue side has caused a decline in the ratio, they should consider problems in the sales and distribution department.
- The gross profit ratio is also known as the contribution from sales. The contribution from sales helps the business be on track. For example, if we want to accumulate a profit of $500 and earn a contribution of $5 per unit, we must sell at least 100 units to meet our target. If there is not enough market for 100 units, we either need to decrease the production cost or increase the sales price.
- By comparing the gross margin ratio of various companies in the same industry or similar business environments, we could easily assess the superiority or inferiority of the respective company concerning its peers. So, it turns out to be one of the primary factors to be checked when a better player from the same industry needs to be picked.
Frequently Asked Questions (FAQs)
Can the gross margin be more significant than 100?
Margins may always be mostly 100 percent, but markups can be 200 percent, 500 percent, or 10,000 percent, based on the price and the offer’s total cost. The higher the price and the lower the cost, the higher the markup.
How to add the gross margin formula in Excel?
A gross margin is calculated as a percentage using the formula gross margin = (total revenue – cost of goods sold)/full payment x 100. It displays the company’s earnings after covering all direct costs of producing a good or service.
What is the gross margin formula vs. gross profit?
Gross margin is calculated by dividing gross profit by sales revenue and multiplying the result by 100. In contrast, gross profit is determined by deducting the cost of goods sold (COGS) from the sales income.
How does gross margin differ from net margin?
Gross margin measures the profitability of a company’s core operations, focusing only on the direct costs associated with producing goods or services. Net margin, on the other hand, represents a company’s overall profitability after deducting all expenses, including operating expenses, taxes, interest, and other non-operating items.
Recommended Articles
This article is a guide to Gross Margin Formula and what is it. Here, we discuss how to calculate it, examples, and importance. You can learn more about financial analysis from the following articles: –