What Is Financial Modeling In Excel?
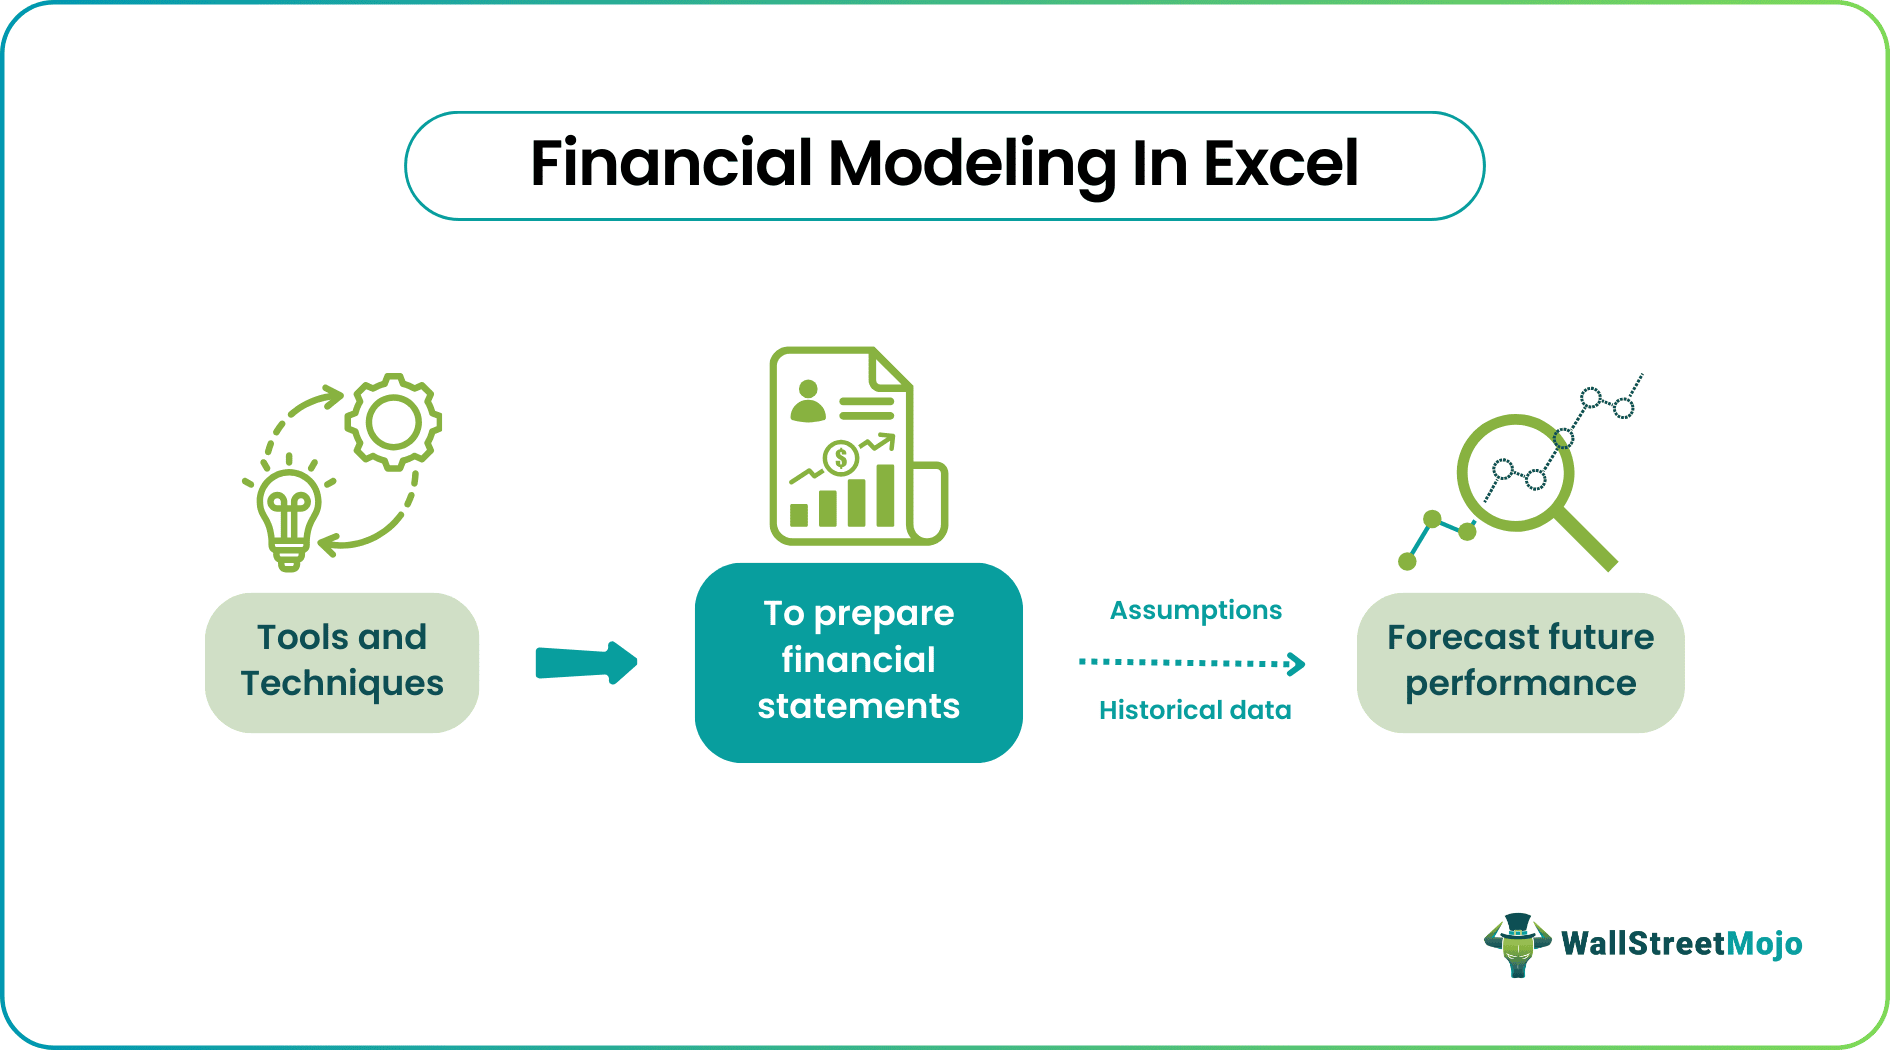
Financial modeling in Excel refers to tools used for preparing the expected financial statements predicting the company’s financial performance in a future period using the assumptions and historical performance information. One may use such financial models in DCF valuations, mergers and acquisitions, private equity, project finance, etc.
The companies intend to use it as a method of decision-making, estimating the future costs and profitability levels of their current strategies that they have implemented or the viability of future projects and investments. The models help the management anticipate what will be the impact of a particular decision or project on the stock prices and market valuation of the company.
Key Takeaways
- Financial modeling in Excel refers to a process that involves using spreadsheets to mathematically represent a company’s historical data and forecast financial performance for future years.
- One uses a financial model created using Excel to make key decisions in mergers and acquisitions, project finance, etc. Moreover, they can use the model to project future costs.
- Some crucial tips for financial modeling in Excel include focusing on accuracy and making the most of various Excel functions.
- Individuals can start the process by downloading a company’s financials and populating them in a spreadsheet.
Financial Modeling In Excel Explained
Financial modeling in Excel is all around the web. There has been a lot written about learning financial modeling. However, most of the financial modeling pieces of training are the same. It goes beyond the usual gibberish and explores practical financial modeling used by Investment Bankers and Research Analysts.
The process of financial modeling makes use of historical data as well as current data to make an evaluation and assessment of the future of the business with regard to its profitability, cost, revenue, sales, and overall financial performance. It acts as a guide to decision-making, providing the management with a proper plan of action to drive the business toward success and growth.
Excel is a tool that is commonly used for this practice. However, even though creating financial models in excel has a lot of value and unlimited scope of usage in the industries, it is not explored to its optimum extent. It is a skill and part of financial analysis that combines the use of financial skills, accounting skills and data analysis to attain the objective of forecasting the future.
Microsoft Excel provides the perfect base for this analysis through the use of financial statements, which are profit and loss statements, cash flow statements, balance sheets, and all other supporting documents. The accuracy of the projections made will largely depend on the availability of data, the accuracy of the information, and the skills and knowledge of the professionals who create the model.
In this free financial modeling Excel guide, we will take the example of Colgate Palmolive (2016 – 2020) and prepare a fully integrated financial model from scratch.
This guide for creating financial models in excel is over 5,000 words and took me three weeks to complete. Therefore, save this page for future reference, and do not forget to share it.
Creating financial models helps business achieve their financial goals by assessing other factors simultaneously. If you want to excel in this field as an analyst, having in-depth knowledge is desired. This Financial Modeling Course can help you achieve your career goals hassle-freely.
Moreoever, if you wish to know more about other features of Excel that can help make your working with multiple data sets easier, you can enroll in this Crash Course In Excel Lookup Function today!
Financial Modeling in Excel Training – Read Me First
- Step 1 – Download the Colgate Financial Model Template.
- Step 2 – Please note you will get two templates – 1) Unsolved Colgate Palmolive Financial Model and 2) Solved Colgate Palmolive Financial Model.
- Step 3 – You will work on the Unsolved Colgate Palmolive Financial Model Template. Follow the step-by-step instructions to prepare a fully integrated financial model.
- Step 4 – Happy Learning!
- If you are new to financial modeling, look at this guide on What is Financial Modeling?
How To Create?
Let us look at how one can build a financial model from scratch. This detailed financial modeling guide will provide a step-by-step guide to creating a financial model. The primary approach taken in this financial modeling guide is Modular. The modular system essentially means building core statements like income statements, balance sheets, and cash flows using different modules/sheets. The key focus is to prepare each statement step by step and connect all the supporting programs to the core statements on completion. We understand that this may not be clear now. However, you will realize this is very easy as we move forward.
- Step 1 – Colgate’s Financial Model – Historical
- Step 2 – Ratio Analysis of Colgate Palmolive
- Step 3 – Projecting the Income Statement
- Step 4 – Working Capital Forecast
- Step 5 – Depreciation Forecast
- Step 6 – Amortization Forecast
- Step 7 – Other Long Term Forecast
- Step 8 – Completing the Income Statement
- Step 9 – Shareholder’s Equity Forecast
- Step 10 – Shares Outstanding Forecast
- Step 11 – Completing the Cash Flow Statements
- Step 12 – Debt and Interest Forecast
Please note the following –
- The core statements are the Income Statement, Balance Sheet, and Cash Flows.
- The different sheets are the depreciation forecast, working capital forecast, intangibles forecast, shareholder’s equity forecast, other long term items forecast, debt forecast schedule, etc.
- The different schedules are linked to the core statements upon their completion.
- This financial modeling guide will build a step-by-step integrated economic model of Colgate Palmolive from scratch.
Step #1 – Financial Modeling in Excel – Project the Historicals
The first step in the financial modeling guide is to prepare the historicals.
Download Colgate’s 10K Reports
One prepares financial models in Excel. The first steps start with knowing how the industry has been doing recently. Understanding the past can provide valuable insights into the company’s future. Therefore the first step is to download all the company’s financials and populate the same in an Excel sheet. For Colgate Palmolive, you can download the annual reports of Colgate Palmolive from their Investor Relation Section.
Create the Historical Financial Statements Worksheet
- If you download 10K of 2020, you will note that only two years of financial statement data is available. However, for financial modeling in Excel, the recommended dataset is to have the last 5 years of financial statements. Therefore, please download the last 3 years of the annual report and populate the historical.
- Often, these tasks seem too tedious as it may take a lot of time and energy to format and put the excel in the desired format.
- However, while designing excel financial modeling template, one should not forget that this is the work you are required to do only once for each company. Populating the historicals also helps an analyst understand the trends and financial statements.
- So, please do not skip this. Instead, download and populate the data (even if you feel this is the donkey’s work).
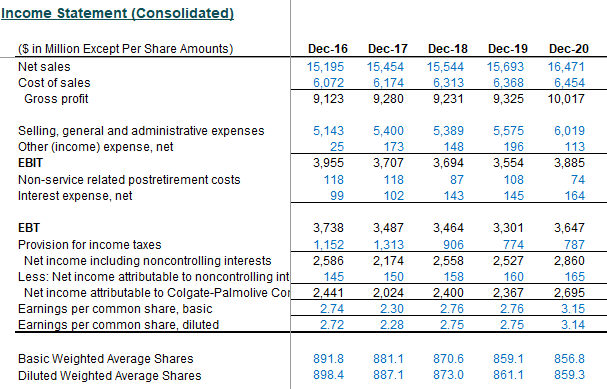
Colgate Income Statement with Historical Populated
Colgate Balance Sheet Historical Data
Step #2 – Ratio Analysis
The second step in financial modeling in Excel is to perform ratio analysis. We covered this in detail in part 1 of the series – Ratio Analysis
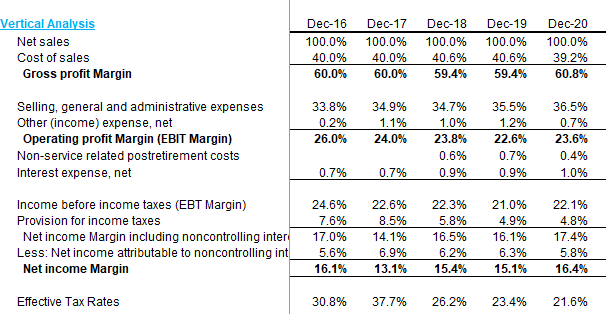
Vertical Analysis of Colgate
On the income statement, the vertical analysis is a universal tool for measuring the firm’s relative performance from year to year in terms of cost and profitability. Therefore, in an excel financial modeling template, it should always be included as part of any financial analysis. Here, percentages are computed concerning net sales, which is considered 100%. This vertical analysis effort in the income statement is often referred to as margin analysis since it yields different margins concerning sales.
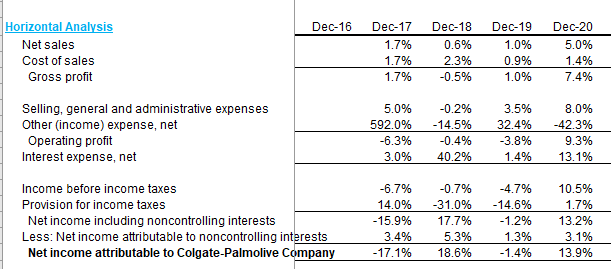
Horizontal Analysis of Colgate
Horizontal analysis is a technique used to evaluate trends over time by calculating percentage increases excel or decreases relative to a base year. It provides an analytical link between accounts calculated at different dates using the currency with varying purchasing powers. In effect, this analysis indexes the reports and compares these evolved. As with the vertical analysis methodology, issues that need to be investigated and complemented with other financial analysis techniques will surface. The focus is to look for symptoms of problems that one can diagnose using additional methods.
Let us look at the horizontal analysis of Colgate.
Liquidity Ratios of Colgate
- Liquidity ratios measure the relationship of the more liquid assets of an enterprise (the ones most easily convertible to cash) to current liabilities. The most common liquidity ratios are the current ratio, Acid test (or quick asset) ratio Cash Ratios.
- Turnover Ratios like Accounts Receivables turnover, inventory turnover, and payables turnover.
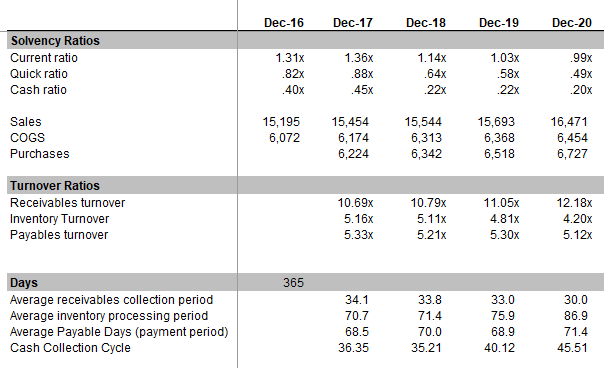
Also, have a look at this detailed article on Cash Conversion Cycle
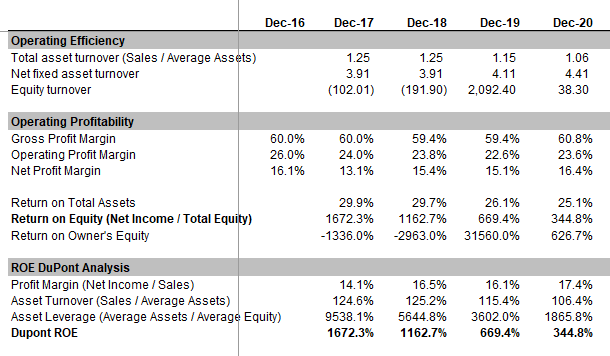
Operating Profitability Ratios of Colgate
Profitability ratios are a company’s ability to generate earnings relative to sales, assets, and equity.
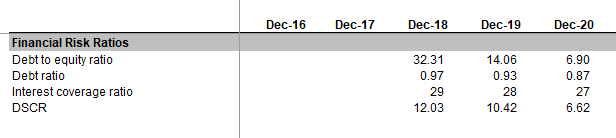
Risk Analysis of Colgate
Through Risk Analysis, we try to gauge whether the companies will be able to pay their short and long-term obligations (debt). We calculate leverage ratios that focus on the sufficiency of assets or generation from assets. Rates that looks at are:
- Debt to Equity Ratio
- Debt ratio
- Interest Coverage Ratio
Step #3 – Financial Modeling in Excel – Project the Income Statement
The third step in financial modeling is to forecast the income statement, wherein we will start with modeling the sales or revenue items.
Revenues Projections
For most companies, revenues are a fundamental driver of economic performance. Therefore, a well-designed and logical revenue model reflecting the type and amounts of income flows accurately is extremely important. There are as many ways to create a revenue schedule as there are businesses. Some common types include:
- Sales Growth: Sales growth assumption in each period defines the change from the previous period. It is a simple and commonly used method but offers no insights into the components or dynamics of growth.
- Inflationary and Volume/ Mix effects: Instead of a simple growth assumption, a price inflation factor and a volume factor are used. This useful approach allows the modeling of fixed and variable costs in multi-product companies and considers price vs. volume movements.
- Unit Volume, Change in Volume, Average Price, and Change in Price: This method is appropriate for businesses with a simple product mix. It permits analysis of the impact of several key variables.
- Dollar Market Size and Growth: Market share and change in share – useful for cases where information is available on market dynamics and where these assumptions are likely to be fundamental to a decision. For example, the telecom industry.
- Unit Market Size and Growth: This is more detailed than the preceding case and is useful when pricing in the market is a crucial variable. (For a company with a price-discounting strategy. For example, a best-of-breed premium-priced niche player) e.g., the luxury car market
- Volume Capacity, Capacity Utilization Rate, and Average Price: These assumptions can be important for businesses where production capacity is essential to the decision. (In purchasing additional capacity, for example, or determining whether the expansion would require new investments).
- Product Availability and Pricing
- Revenue was driven by investment in capital, marketing, or R&D
- Revenue-based on installed base (continuing sales of parts, disposables, services, add-ons, etc.). Examples include classic razor-blade businesses and businesses like computers where sales of service, software, and upgrades are essential. Again, modeling the installed base is key (new additions to the floor, attrition in the ground, continuing revenues per customer, etc.).
- Employee based: For example, revenues of professional services firms or sales-based firms such as brokers. Modeling should focus on net staffing and revenue per employee (often based on billable hours). More detailed models will include seniority and other factors affecting pricing.
- Store, facility, or Square footage based: Retail companies are often modeled based on stores (old stores plus new stores each year) and revenue per store.
- Occupancy-factor-based: This approach applies to airlines, hotels, movie theatres, and other businesses with low marginal costs.
Projecting Colgate Revenues
Let us now look at the Colgate 10K 2020 report. First, Colgate has not provided segmental information in the income statement. However, as additional information, Colgate has provided details of each segment.
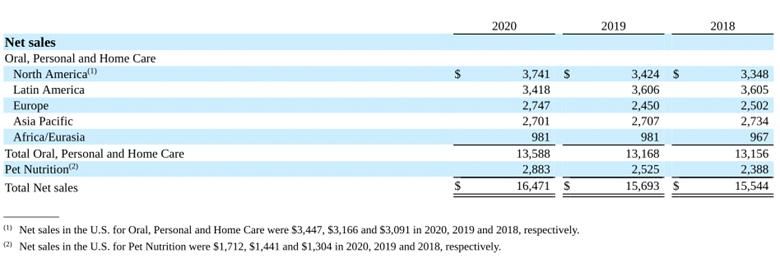
Source – Colgate 2020 – 10K, Page 119
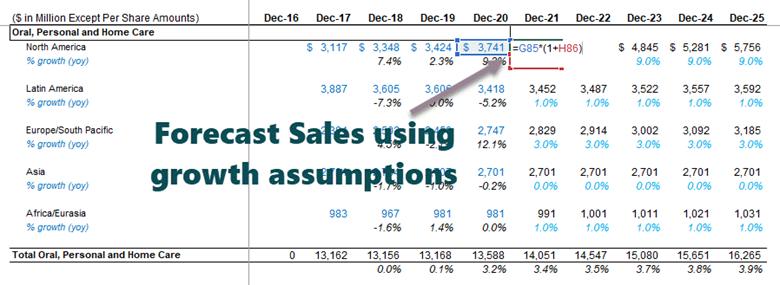
Since we do not have any further information about the features, we will project the future sales of Colgate based on this available data. We will use the sales growth approach across segments to derive the forecasts. Please see the picture below. We have calculated the year-over-year growth rate for each element.
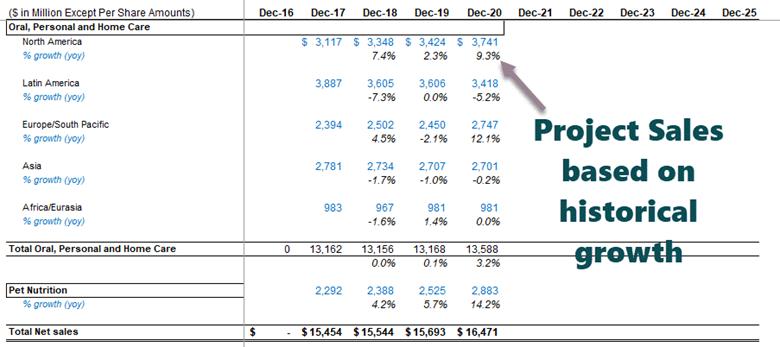
Now, we can assume a sales growth percentage based on the historical trends and project the revenues under each part. Therefore, total net sales are the total of the Oral, Personal & Home Care, and Pet Nutrition Segment.
Costs Projections
- Percentage of Revenues: Simple but offers no insight into any leverage (economy of scale or fixed cost burden.
- Costs other than depreciation as a percent of revenues and depreciation from a different schedule: This approach is the minimum acceptable in most cases and permits only partial analysis of operating leverage.
- Variable costs based on revenue or volume, fixed costs based on historical trends, and depreciation from a different schedule. This approach is the minimum necessary for sensitivity analysis of profitability based on multiple revenue scenarios.
Cost Projections for Colgate
For projecting the cost, the vertical analysis done earlier will be helpful. So, let us have a relook at the vertical analysis:
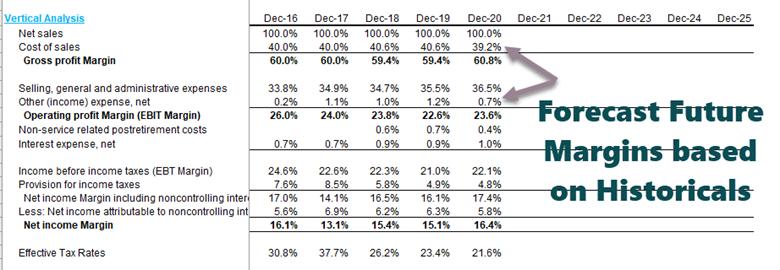
- Since we have already forecasted sales, all the other costs are some margins of these sales.
- The approach is to take the guidelines from the historical cost and expense margins and then forecast the future margin.
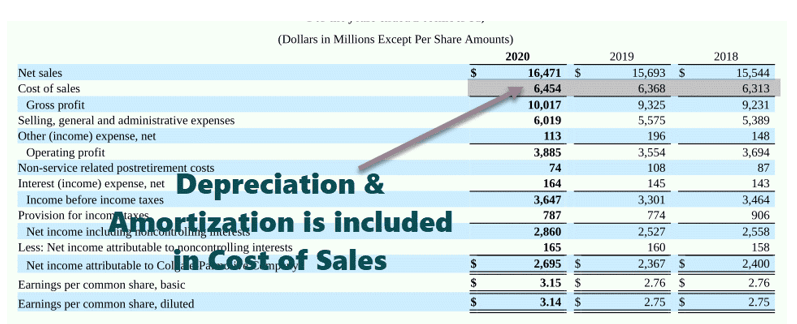
- For example, the cost of sales has been in the range of 39.2%-40.6% for the past five years. So we can look at forecasting the margins on this basis.
- Likewise, selling, general, and Administrative Expenses have been historically in the range of 33.8%-36.5%. We can assume the future SG&A expense margin on this basis. Likewise, we can go on for another set of expenses.
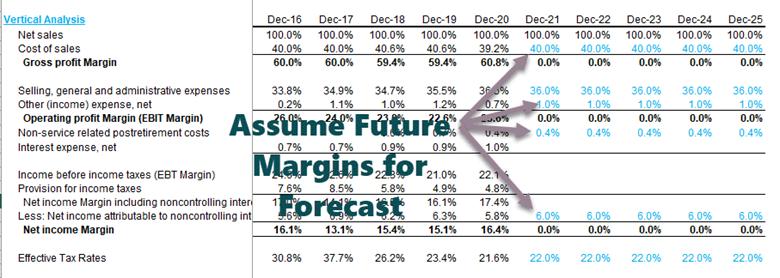
Using the above margins, we can find the actual values by back calculations.
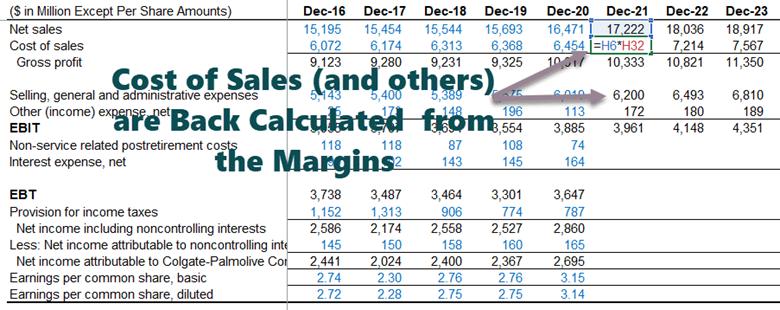
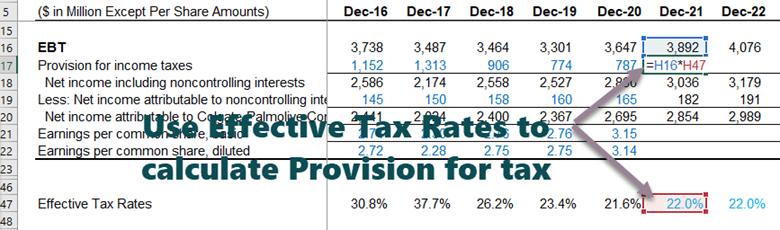
We use the effective tax rate assumption to calculate the provision for taxes.
- Also, note that we do not complete the “Interest Expense (Income)” row as we will look at the income statement later.
- Interest Expense and Interest Income.
- We have also not calculated depreciation and amortization, which we have already included in the cost of sales.
- This completes the income statement (at least for the time being!).
If individuals wish to develop their practical understanding of projecting the income statement and other steps in the financial modeling process, enrolling in the Financial Modeling 2-Day Bootcamp can be helpful. This expert-led course has been created to help learners understand how they can adopt a step-by-step approach to creating a financial model from scratch.
Step #4 – Financial Modeling – Working Capital Schedule
Now that we have completed the income statement, the fourth step in financial modeling is to look at the working capital schedule.
Below are the steps that one must follow for a working capital schedule.
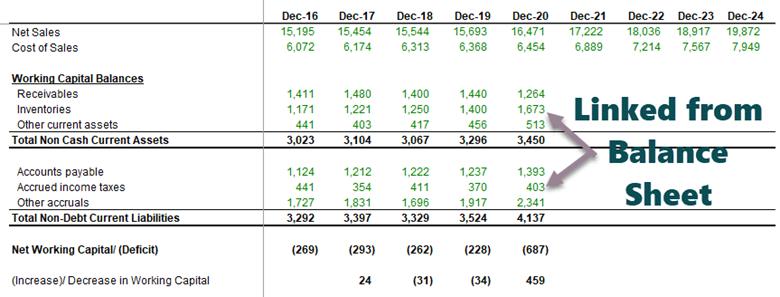
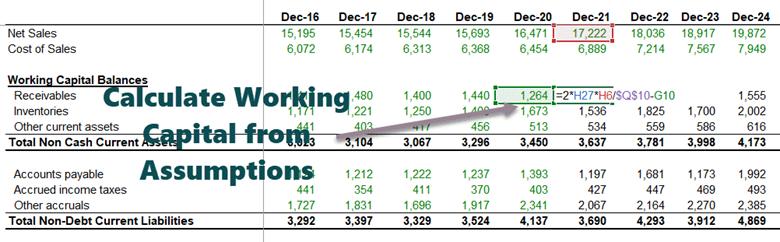
Link the Net Sales and Cost of Sales
Reference the Balance Sheet Data related to working capital
- Reference the past data from the balance sheet.
- Calculate net working capital
- Arrive at an increase/ decrease in working capital
- Note that we have not included short-term debt and cash and cash equivalents in the working capital. We will deal with debt and cash and cash equivalents separately.
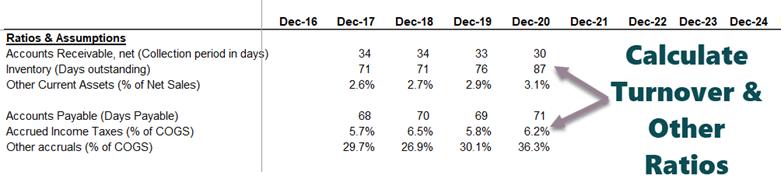
Calculate the Turnover Ratios
- Calculate historical ratios and percentages
- Use the ending or average balance.
- Both are acceptable as long as consistency is maintained.
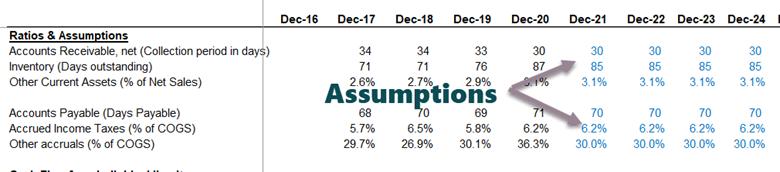
Populate the assumptions for future working capital items
- Certain items without a prominent driver are assumed usually at constant amounts.
- Ensure assumptions are reasonable and in line with the business.
Project the future working capital balances
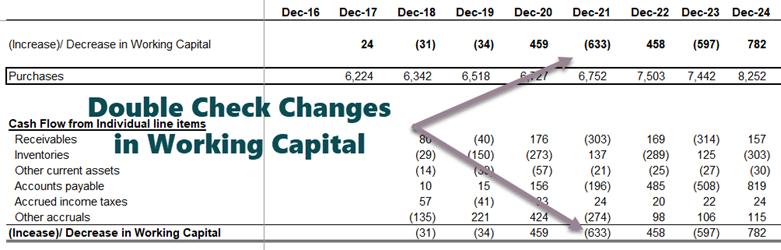
Calculate the changes in Working Capital
- Arrive at cash flows based on individual line items.
- Ensure signs are accurate!
Link up the Working Capital Forecasts to the Balance Sheet
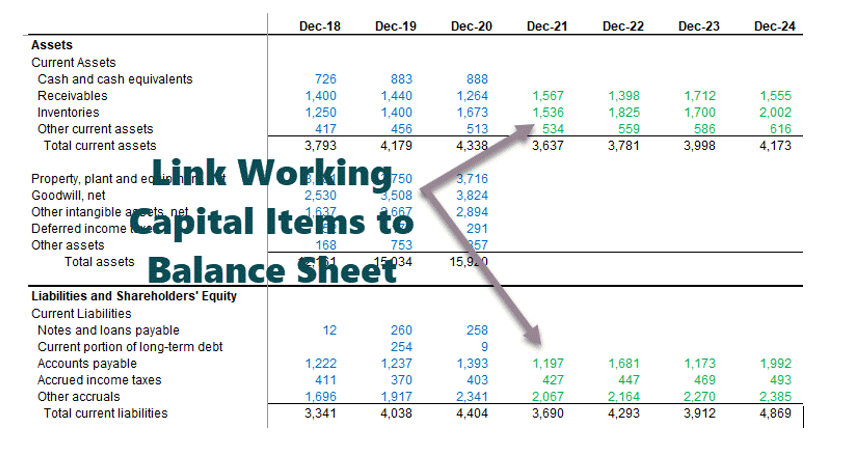
Link Working Capital Items to the Cash Flow Statement
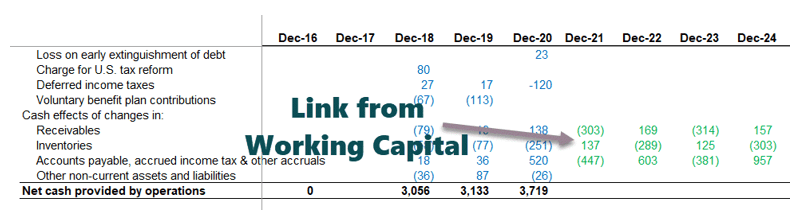
Step #5 – Financial Modeling in Excel – Depreciation Schedule
With the completion of the working capital schedule, the next step in this financial modeling is to project the Capex of Colgate and the depreciation and assets figures.
source – Colgate 10K 2020 Page – 72
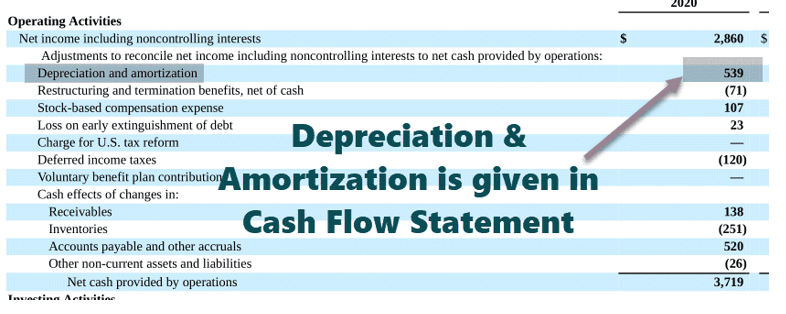
- It has not provided depreciation and amortization as separate line items. However, it is included in the cost of sales.
- In such cases, please look at the cash flow statements, where you will find the depreciation and amortization expense. Also, note that the below figures are 1) Depreciation and 2) amortization. So, what is the depreciation number?
- Ending Balance for PPE = Beginning balance + Capex – Depreciation – Adjustment for Asset Sales (BASE equation).
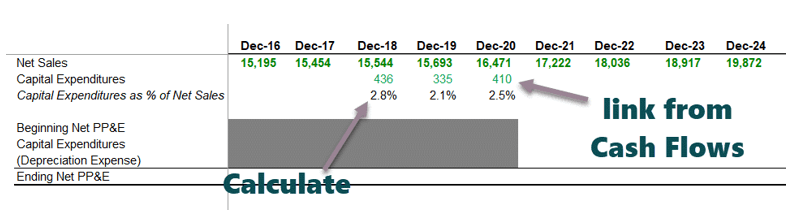
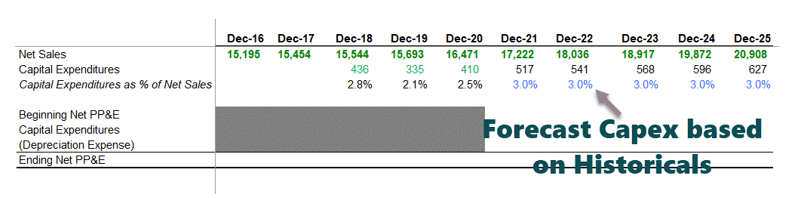
Link the Net Sales figures in the Depreciation Schedule
- Set up the line items
- Reference net sales
- Input past capital expenditures
- Arrive at Capex as a % of net sales
Forecast the Capital Expenditure Items
- There are various approaches to forecasting capital expenditure. One common practice is to look at the press releases, management projections, and MD&A to understand the company’s view on future capital expenditure.
- If the company has guided future capital expenditure, we can take those numbers directly.
- However, if the Capex numbers are not directly available, we can calculate it crudely using Capex as % of Sales (as done below).
- Use your judgment based on industry knowledge and other reasonable drivers.
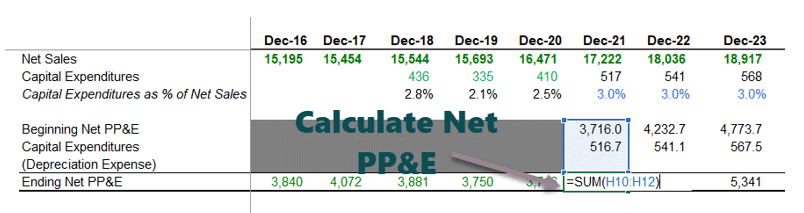
Reference Past Information and Calculate Net PP&E
- We will use Ending Balance for PPE = Beginning balance + Capex – Depreciation – Adjustment for Asset Sales (BASE equation)
- It is complicated to reconcile past PP&E due to restatements, asset sales, etc.
- It is therefore recommended not to reconcile the past PPE as it may lead to some confusion.
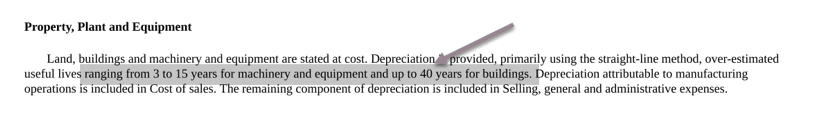
Depreciation Policy of Colgate
- Colgate has not explicitly provided a detailed breakup of the Assets. Instead, they clubbed all assets into the land, building, machinery, and other equipment.
- Also, useful lives for machinery and equipment are provided in range. In this case, we will have to do some guesswork to determine the average useful life left for the assets.
- Also, guidance for useful life is not provided for “Other equipment.” Therefore, we will have to estimate the useful life of other equipment.
Colgate 2020 – 10K, Page 79
Below is the breakup of 2012 and 2013 Property, Plant, and Equipment Details
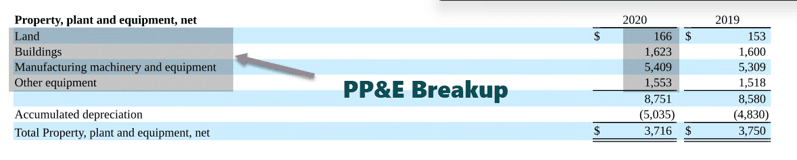
Colgate 2020 – 10K, Page 125
Estimate the breakup of Property Plant and Equipment (PPE)
- In a financial modeling in excel course, first, find the Asset weights of the Current PPE (2020)
- We will assume that these asset weights of 2020 PPE will continue going forward.
- We use these asset weights to calculate the breakup of estimated capital expenditure.
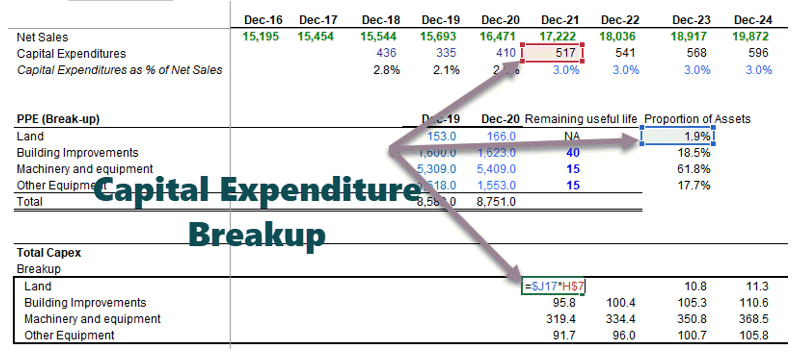
Estimate the Depreciation of Assets
In a In a financial modeling in excel course, we also learn the following:
- Please note that we do not calculate depreciation of Land as land is not a depreciable asset.
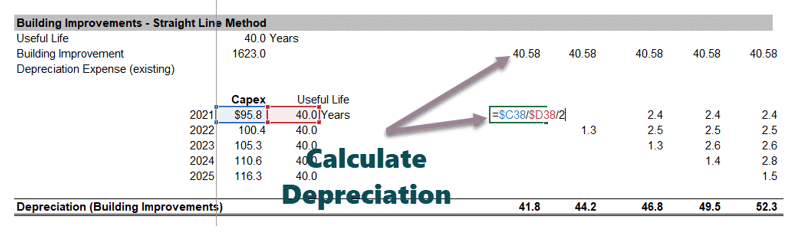
- For estimating depreciation from Building improvements, we first make use of the below structure.
- Depreciation here is divided into two parts: 1)Depreciation from the building improvements asset already listed on the balance sheet, 2) depreciation from the future Building improvements.
- We use the simple Straight Line Method of depreciation to calculate the depreciation from building improvements listed on the asset.
- For calculating future depreciation, we first transpose the Capex using the TRANSPOSE Function in Excel.
- We calculate the depreciation from asset contributions from each year.
- Also, the first-year depreciation is divided by two as we assume the mid-year convention for asset deployment.
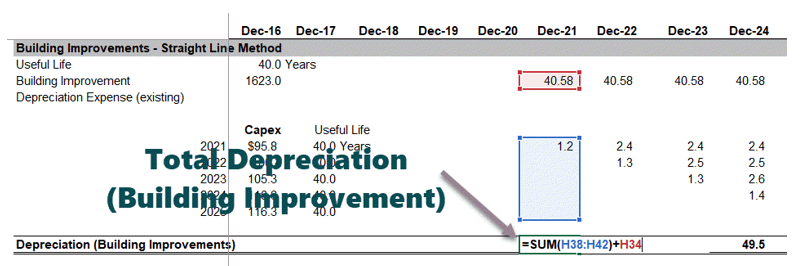
Total Depreciation of Building improvement = depreciation from the asset already listed on the balance sheet + depreciation from the future building improvements.
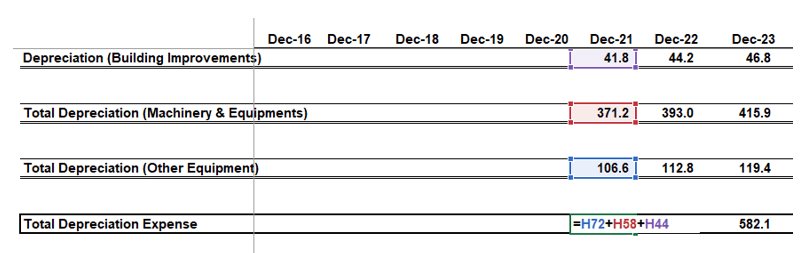
In the above process for estimating depreciation, one may calculate the depreciation of 1) manufacturing equipment & machinery and 2) other equipment, as shown below.
Total Depreciation of Colgate = Depreciation (Building Improvements) + Depreciation (Machinery & Equipment) + Depreciation (additional equipment)
Once we have found the real depreciation figures, we can put that in the BASE equation as shown below.
- With this, we get the ending net PP&E figures for each year.
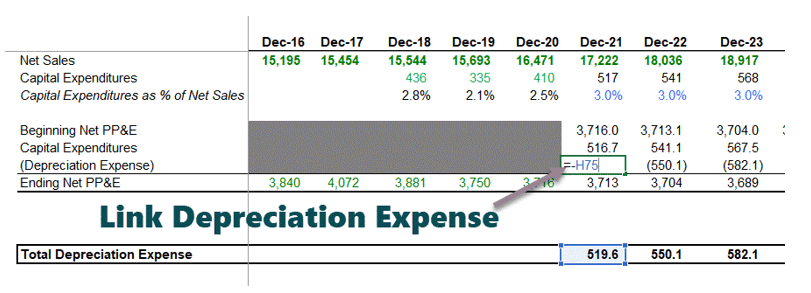
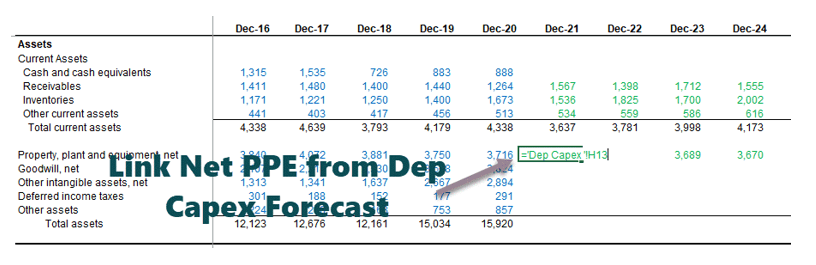
Link the Net PP&E to the Balance Sheet
Step #6 – Amortization Schedule
The sixth step in this financial modeling in Excel is to forecast the amortization. Again, we have two broad categories to consider here – 1) Goodwill and 2) Other Intangibles.
Forecasting Goodwill
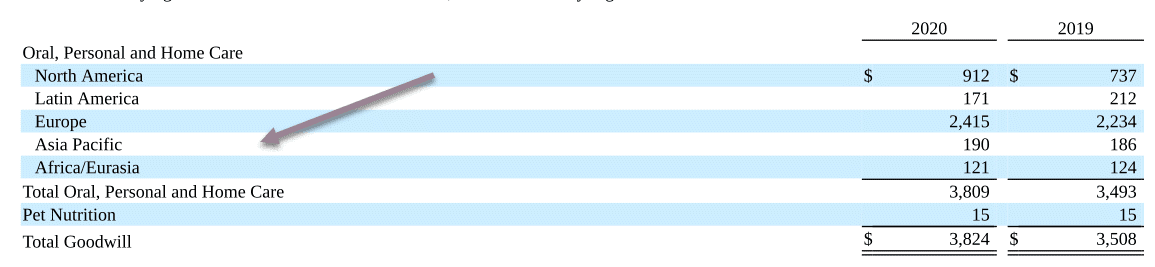
Colgate 2020 – 10K, Page 88
- Goodwill comes on the balance sheet when a company acquires another company. It usually is complicated to project goodwill for future years.
- However, Goodwill is subject to impairment tests annually, which the company performs. Therefore, analysts are in no position to conduct such tests and prepare estimates of impairments.
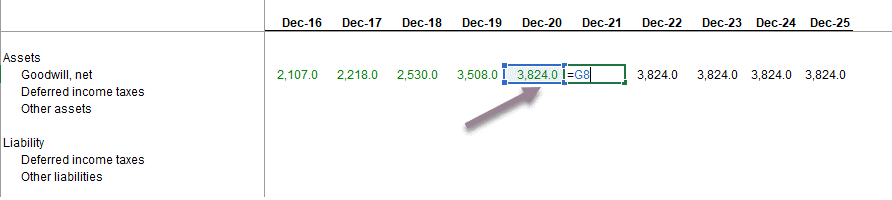
- Most analysts do not project goodwill. They just keep this constant, which we will do in our case.
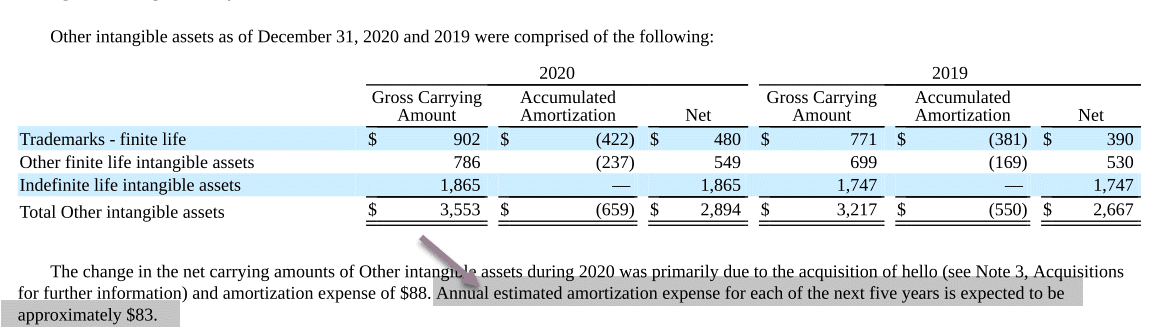
Forecasting Other Intangible Assets
- Colgate’s 10K Report notes that most of the finite life intangible is related to the Sanex acquisition.
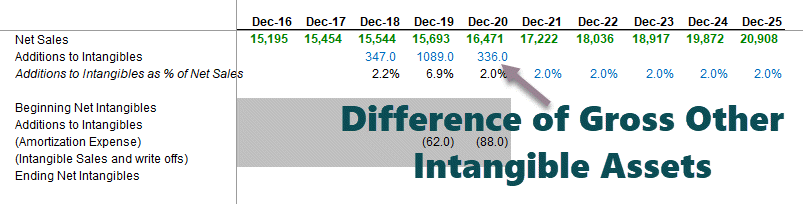
- “Additions to Intangibles” are also complicated to project.
- Colgate’s 10K report provides us with the details of the next five years of amortization expenses.
- We will use these estimates in our financial model.
Colgate 2020 – 10K, Page 88
Calculate Ending Net Intangibles
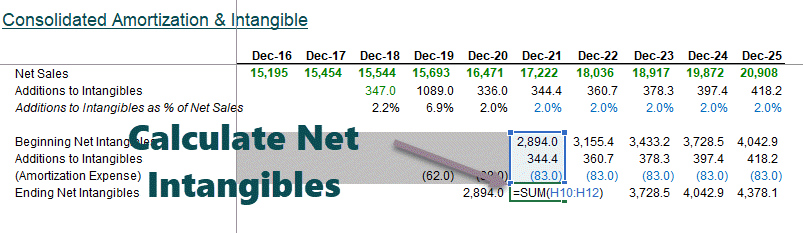
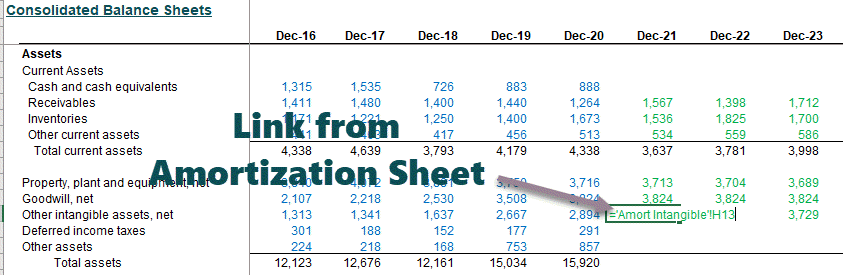
Ending net intangibles are linked to the “Other Intangible Assets.”
Link Depreciation and Amortization to Cash Flow Statements
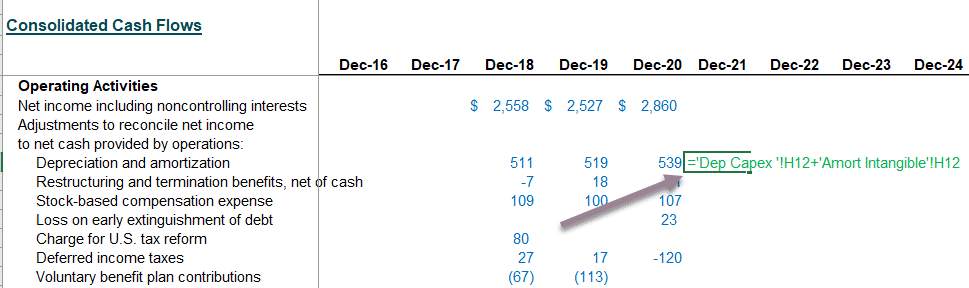
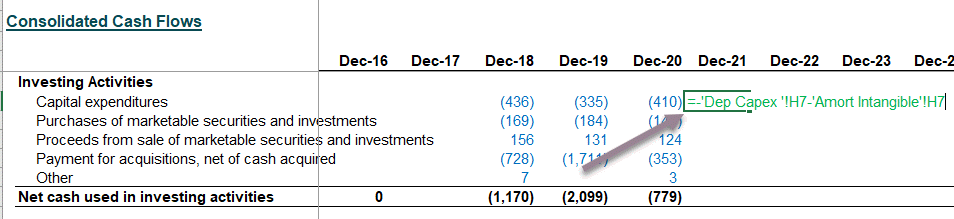
Link Capex & Addition to Intangibles to Cash flow statements

Step #7 – Other Long Term Schedule
The next step in this financial modeling is to prepare the other long-term schedule. It is when we prepare for the “leftovers” that do not have specific drivers for forecasting. In the case of Colgate, the other long-term items (leftovers) were Deferred Income Taxes (liability and assets), other investments, and other liabilities.
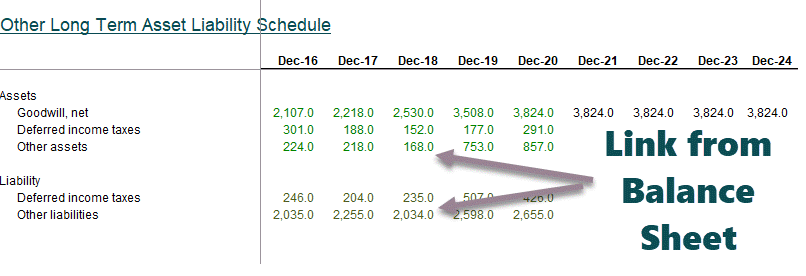
Reference the historical data from the Balance Sheet
Also, calculate the changes in these items.
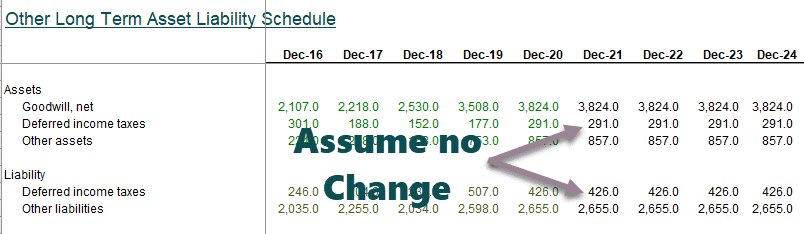
Forecast the Long Term Assets and Liabilities
- Keep the long-term items constant for projected years in case of no visible drivers.
- Link the forecasted long term items to the Balance Sheet as shown below.
Reference Other Long Term Items to the Balance Sheet
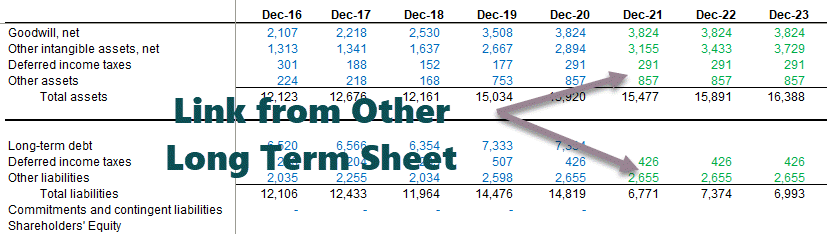
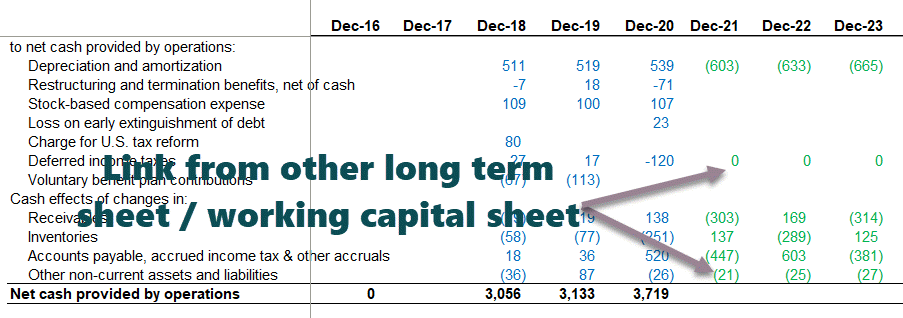
Link the long term items to the Cash Flow Statement
Please note that if we keep the long-term assets and liabilities constant, the change that flows to the cash flow statement would be zero.
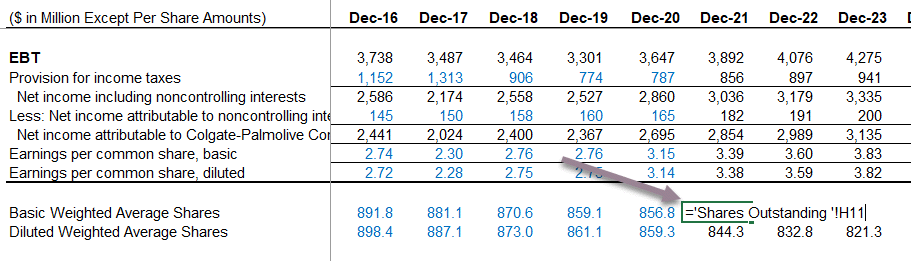
Step #8 – Financial Modeling in Excel – Completing the Income Statement
- Before we move any further in this Excel-based financial modeling, we will review the income statement.
- Populate the historical basic weighted average shares and dilute the weighted average number of shares.
- These figures are available in Colgate’s 10K report.
Reference the basic and diluted shares
At this stage, assume that the future number of primary and diluted shares will remain the same as in 2020.
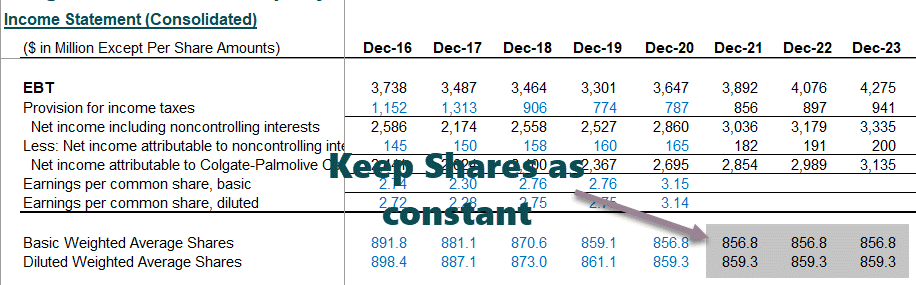
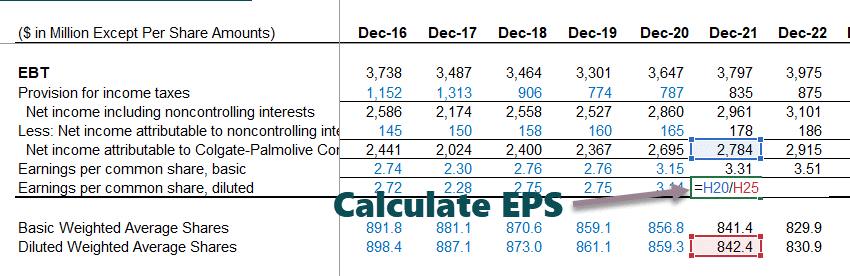
Calculate Basic and Diluted earnings per share
We are ready to move to our next shareholder’s equity schedule.
Step #9 – Financial Modelling – Shareholder’s Equity Schedule
The next step in this financial modeling in Excel training is to look at the shareholder’s equity schedule. The primary objective of this schedule is to project equity-related items like shareholder’s equity, dividends, Share buyback, option proceeds, etc.
Colgate’s 10K report provides us with the details of common and treasury stock activities in the past years, as shown below.
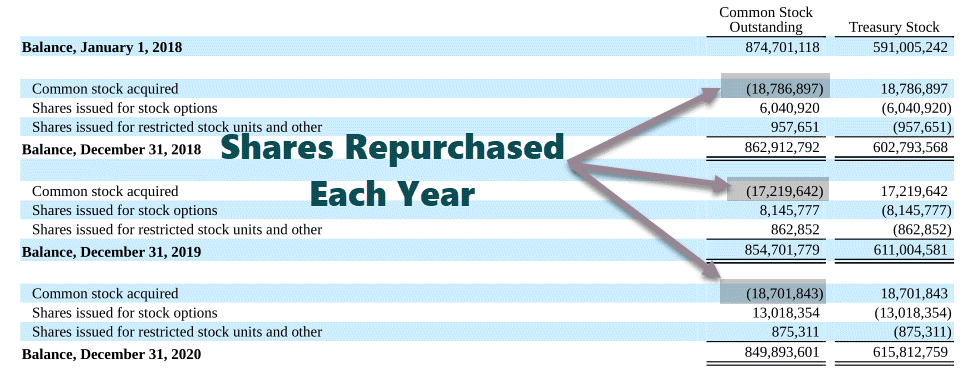
Colgate 10K 2020 – Page 97
Share Repurchase: Populate the historical numbers
- Historically, Colgate has repurchased shares, as shown in the schedule above.
- Populate Colgate’s shares repurchase (millions) in the Excel sheet.
- Link the historical diluted EPS from the income statement.
- The historical amount repurchased should be referenced from the cash flow statements.
Also, have a look at Accelerated Share Repurchase.
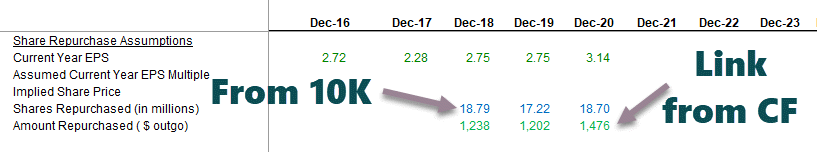
Share Repurchase: Calculate the PE multiple (EPS multiple)
- Calculate the implied average price at which Colgate has done share repurchases historically. One may calculate the Amount repurchased / Number of shares.
- Calculate the PE multiple = Implied Share Price / EPS
Share Repurchase: Finding Colgate’s Share Repurchased
Colgate has not officially announced how many shares they intend to buy back. The only information that their 10K report shares are that they have authorized a buyback of up to 50 million shares.
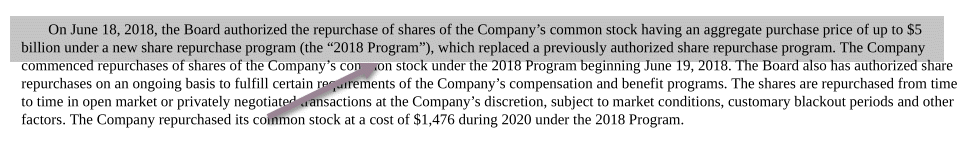
Colgate 10K 2020 – Page 97
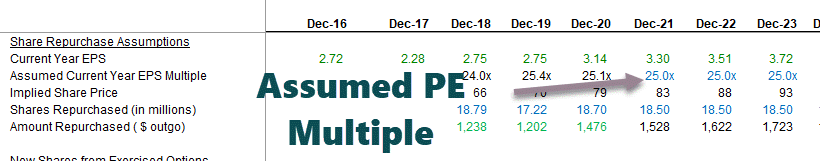
- We need to assume the share repurchase amount to find the number of shares repurchased. Based on the historical repurchase amount, we have taken this number as $1,500 million for all the future years.
- We need the projected implied share price of the potential buyback to find the number of shares repurchased.
- Actual share price = assumed PE multiplex EPS.
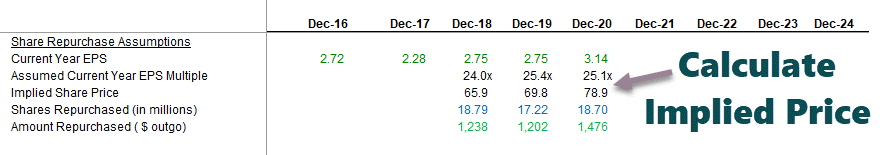
- One can assume future buyback PE multiple based on historical trends. We note that Colgate has repurchased shares at an average PE range of 17x – 25x.
- Below is the snapshot from Reuters that helps us validate the PE range for Colgate.
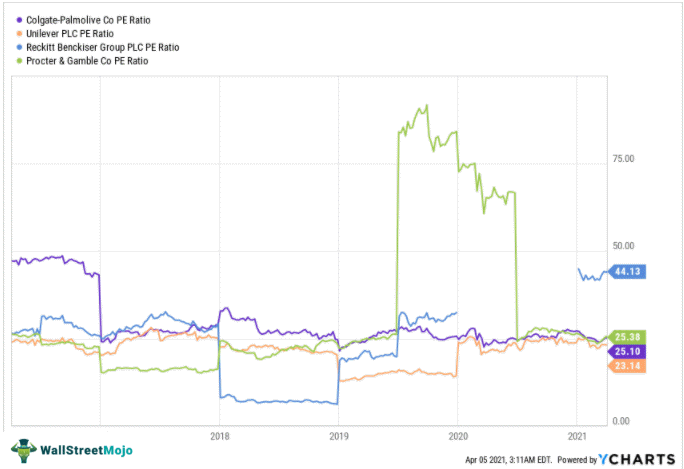
- In our case, we have assumed that all future buybacks of Colgate will be at a PE multiple of 25x.
- Using the PE of 25x, we can find the implied price = EPS x 25.
- Now that we have found the implied price, we can see the number of shares repurchased = $ amount used for repurchase / implied price.
Stock Options: Populate Historical Data
- The common stock and shareholder’s equity summary shows us the number of options exercises each year.
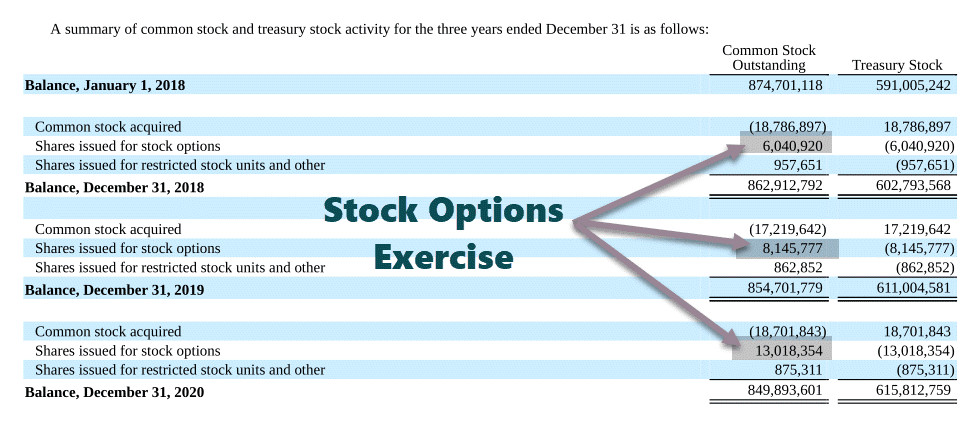
Colgate 2020 – 10K, Page 97
- Besides, we also have the option proceeds from the cash flow statements (approx).
- With this, we should be able to find an effective strike price.
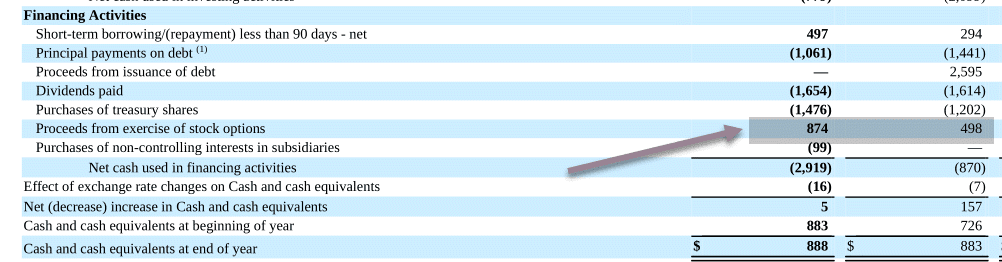
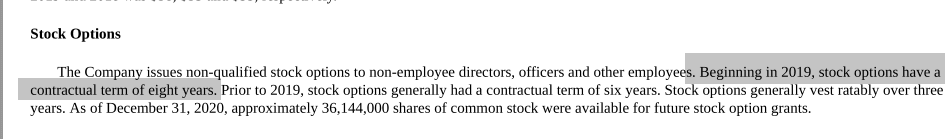
Colgate 2020 – 10K, Page 76
Also, note that the stock options have contractual terms of eight years and vest over three years.
Colgate 2020 – 10K, Page 100
With this data, we fill up the options data as per below. We also note that the weighted average strike price of stock options for 2020 was $72, and the number of options outstanding was 27.541 million.
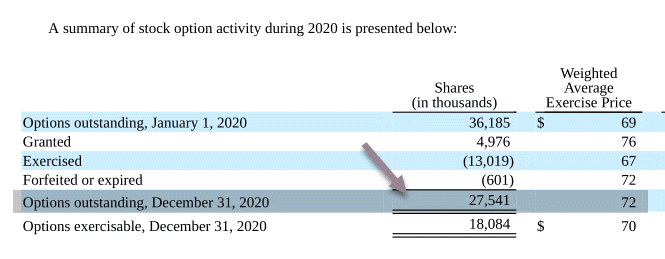
Colgate 2020 – 10K, Page 100
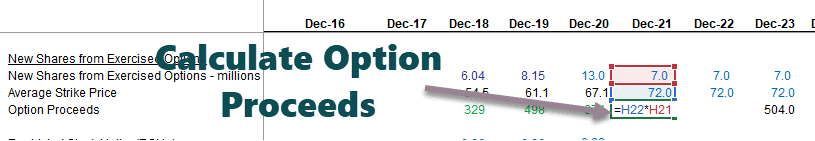
Stock Options: Find the Option Proceeds
Our options data below shows that the option proceeds were $504 million in 2021. We have assumed that 7 million options exercise each year.
Stock Options: Forecast Restricted Stock Unit Data
In addition to the stock options, there are Restricted Stock Units are given to the employees and awarded and vested at the end of each three-year performance period.
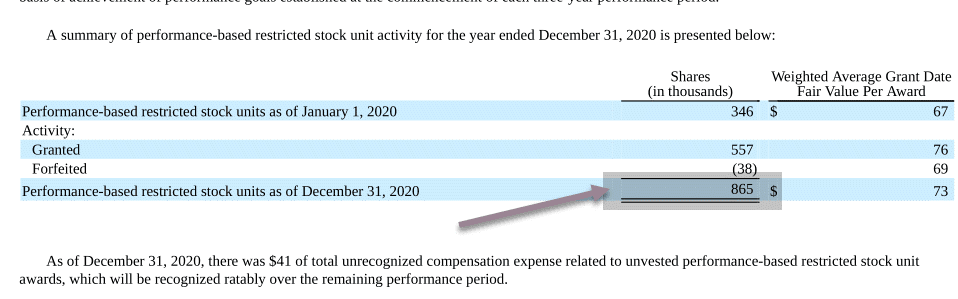
Colgate 2020 – 10K, Page 99
Populating this data in the restricted stock units dataset.
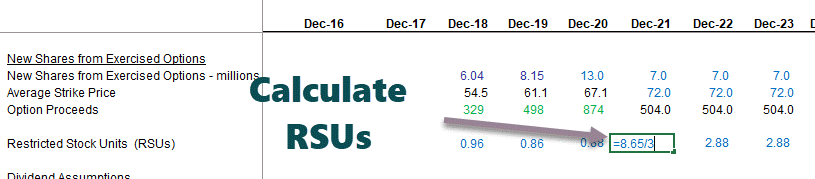
The restricted stock units project to be (8.65/3.0 years), i.e., 2.88 million going forward.
Also, have a look at the Treasury Stock Method.
Dividends: Forecast the Dividends
- Forecast estimated dividends using the Dividend Payout Ratio.
- Fixed dividend outgo per-share payout.
- From the 10K reports, we extract all past information on dividends.
- With the information on dividends paid, we can find the Dividend Payout Ratio = Total Dividends Paid / Net Income.
- We have calculated the dividends payout ratio of Colgate as seen below:
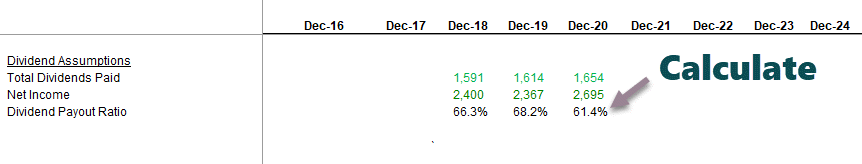
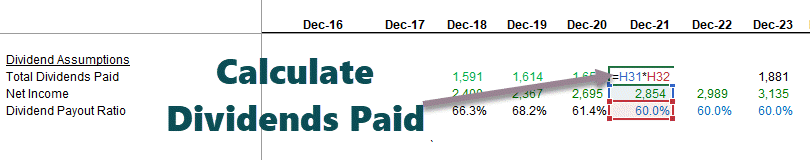
We note that the dividends payout ratio has been broadly in the range of 60%-66%. Therefore, let us assume the dividend payout ratio of 60% in the future years.
- We can also link the projected net income from the income statement.
- Using the projected net income and the dividends payout ratio, we can find the total dividends paid.
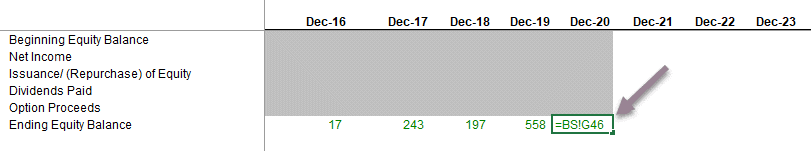
Forecast equity account in its entirety
With the forecast of share repurchase, option proceeds, and dividends, we are ready to complete the shareholder’s equity schedule. Link all these up to find the ending equity balance for each year, as shown below.
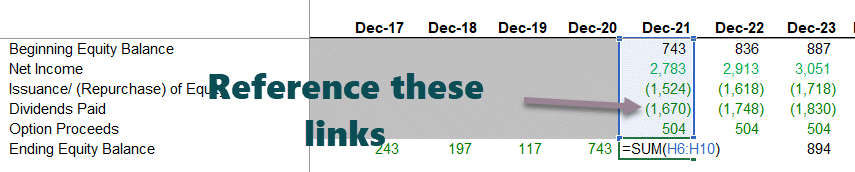
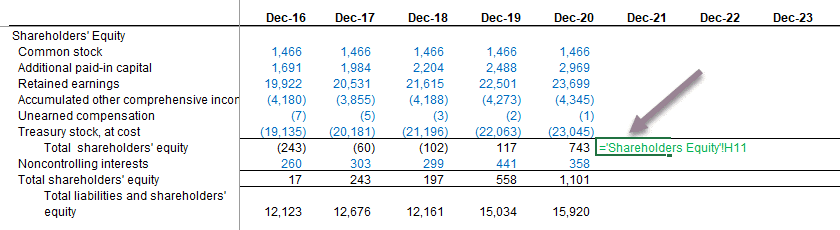
Link Ending Shareholder’s Equity to the Balance Sheet
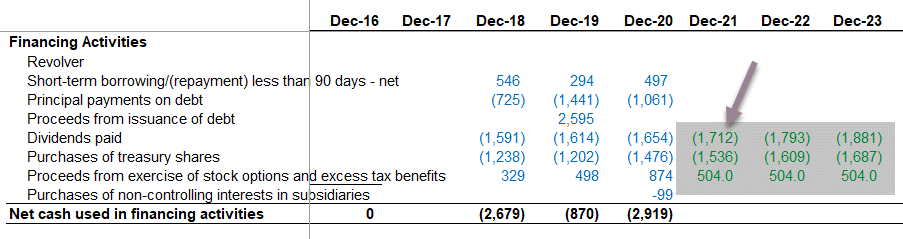
Link Dividends, Share repurchase & Options proceeds to CF

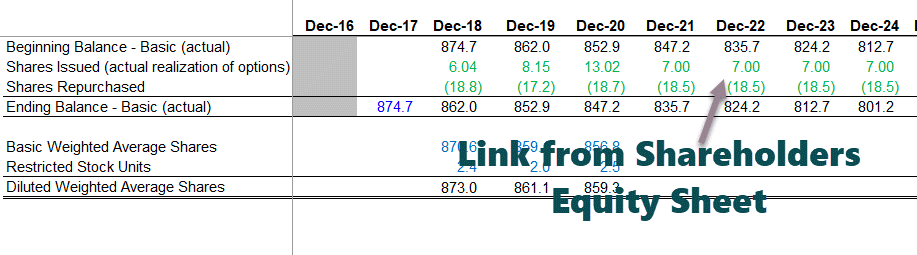
Step #10 – Shares Outstanding Schedule
The next step in this online financial modeling in Excel training is to look at the shares’ outstanding schedule. Summary of shares outstanding schedule:
- Basic Shares – actual and average
- Capture past effects of options and convertibles as appropriate
- Diluted Shares – average
- Reference Shares repurchased and new shares from exercised options
- Calculate forecasted raw percentages (actual)
- Calculate average basic and diluted shares
- Reference projected shares to Income Statement (recall Income Statement Build up!)
- Input historical shares outstanding information
- Note: Commonly, this schedule integrates with the equity schedule.
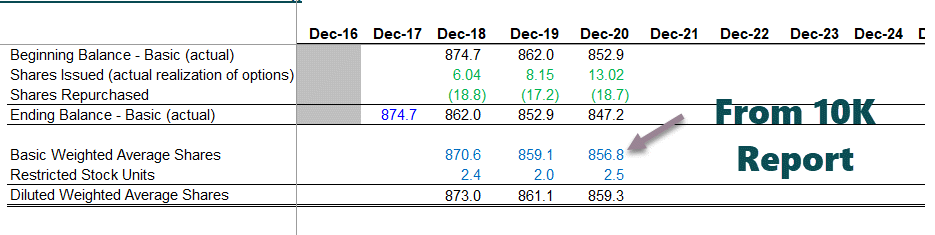
Input the historical numbers from the 10K report
- Shares issued (actual realization of options) and shares repurchased can be referenced from the shareholder’s equity schedule.
- The input weighted an average number of shares and the effect of stock options for the historical years.
Link share issuances & repurchases from the Share Equity Schedule
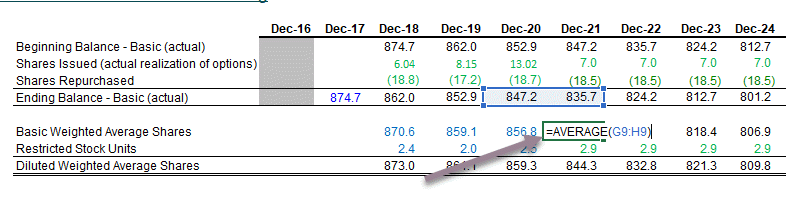
Basic Shares (Ending) = Basic Shares (Beginning) + Share Issuances – Shares Repurchased.
Find the basic weighted average shares
- We find an average of two years, as shown below.
- Also, add the effect of options and restricted stock units (referenced from the shareholder’s equity schedule) to find the diluted weighted average shares.
Link Basic & diluted weighted shares to Income Statement
- Now that we have calculated the diluted weighted average shares, it is time to update the same in the income statement.
- Link up forecasted diluted weighted average shares outstanding to the income statement as shown below.
With this, we complete the shares’ outstanding schedule and time to move to our next set of statements.
Step #11 – Completing the Cash Flow Statements
We must fully complete the cash flow statements before we move to our next and final schedule in this financial modeling, i.e., the debt schedule. Until this stage, there are only a couple of incomplete things.
- Income Statement – interest expense/ income are incomplete at this stage
- Balance Sheet – cash and debt items are incomplete at this stage
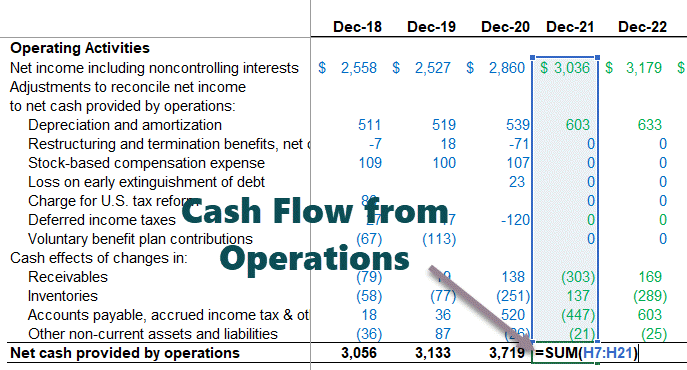
Calculate Cash Flow for Financing Activities
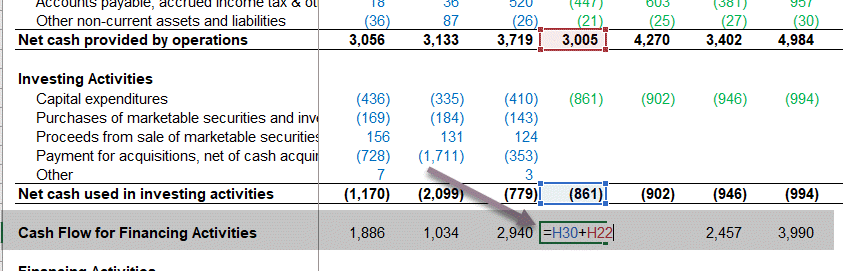
Also, check out Cash Flow from Financing
Find net increase (decrease) in Cash & Cash Equivalents

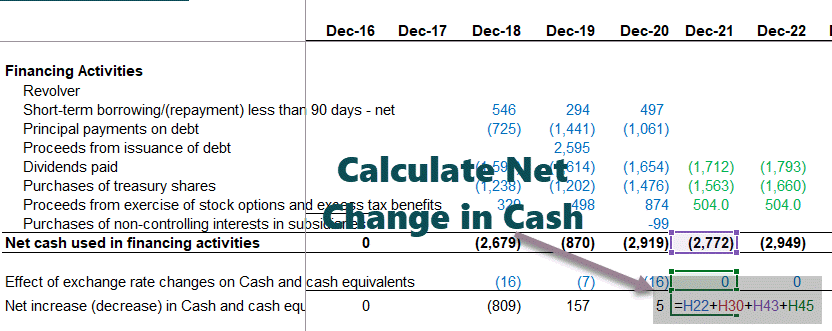
Complete the cash flow statements
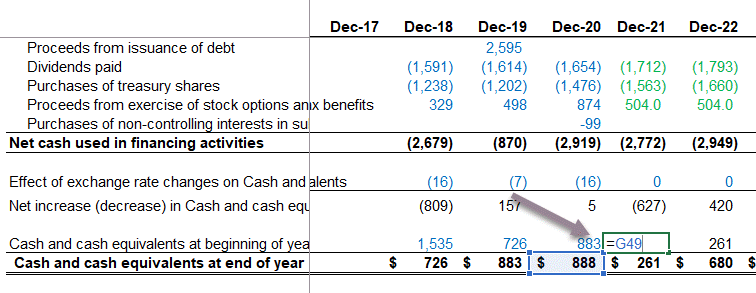
Find the year-end cash and cash equivalents at the end of the year.
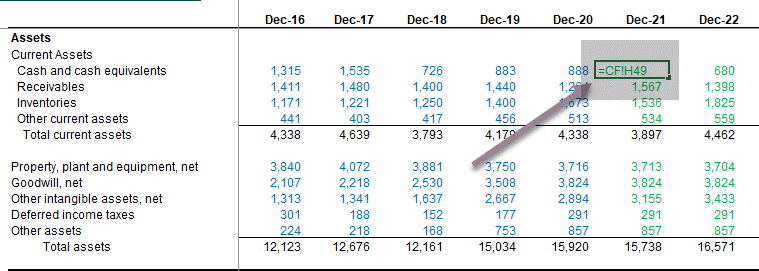
Link the cash & cash equivalents to the Balance Sheet

Now we are ready to take care of our last and final schedule, i.e., Debt and Interest Schedule.
Step #12 – Financial Modeling in Excel – Debt and Interest Schedule
The next step in this online financial modeling is to complete the debt and interest schedule. Summary of the Debt and Interest – Schedule.
Set up a Debt Schedule
- Reference the cash flow available for financing
- Reference all equity sources and uses of cash
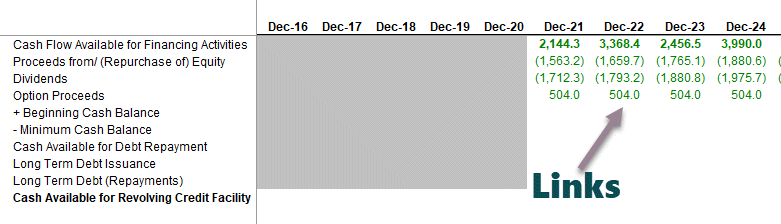
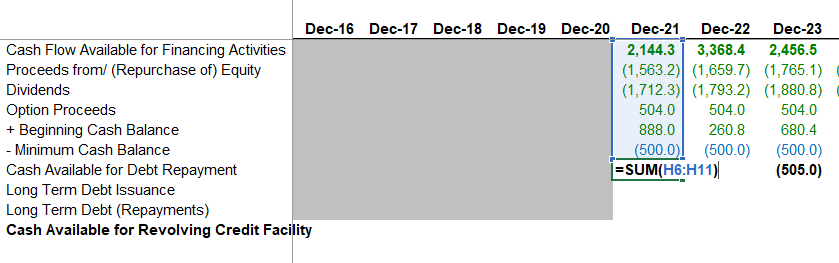
Calculate Cash Flow from Debt Repayment
- Reference the beginning cash balance from the balance sheet.
- Deduct a minimum cash balance. We have assumed that Colgate would like to keep a minimum of $500 million yearly.
Skip long-term debt issuance/ repayments, cash available for revolving credit facility, and revolver section.
Colgate’s 10K report notes the available details on the revolved credit facility.
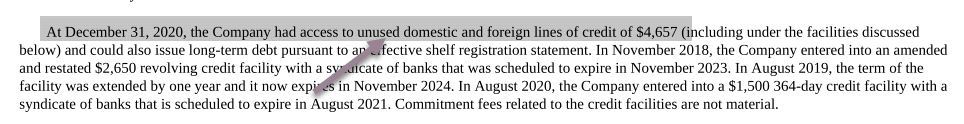
Colgate 2020 – 10K, Page 49
Also provided in additional information on debt is the committed long-term debt repayments.
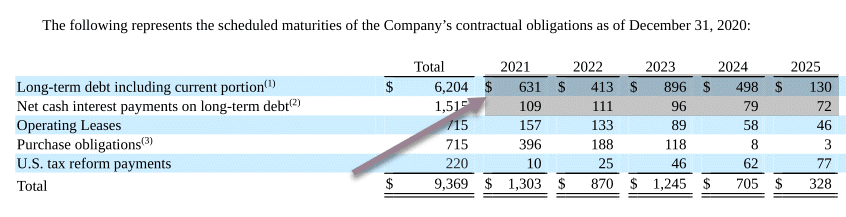
Colgate 2020 – 10K, Page 50
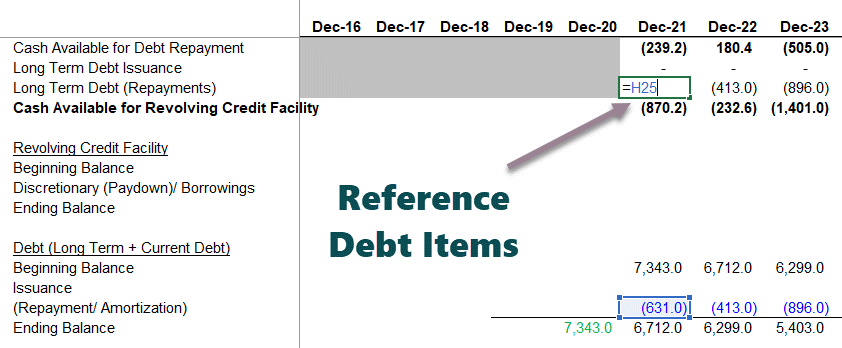
Calculate the Ending Long Term Debt
We use the long-term debt repayment schedule provided above and calculate the ending balance of long-term debt repayments.
Link the long term debt repayments
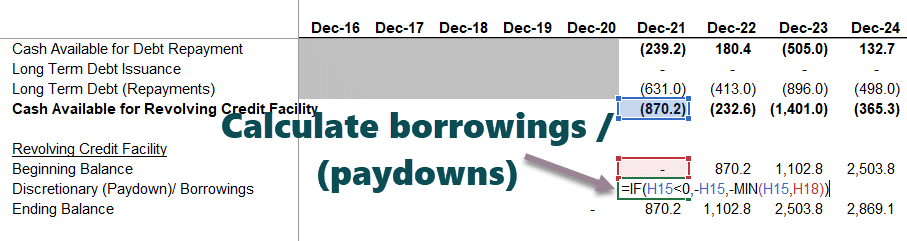
Calculate the discretionary borrowings/paydowns
Using the cash sweep formula, as shown below, calculate the discretionary borrowings/paydown.
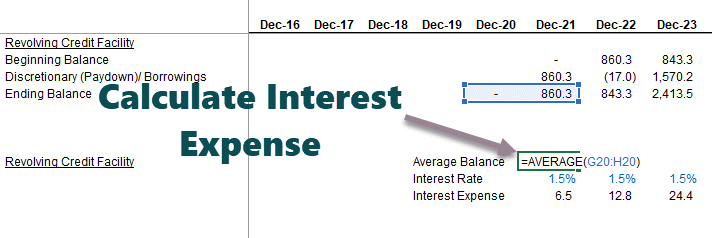
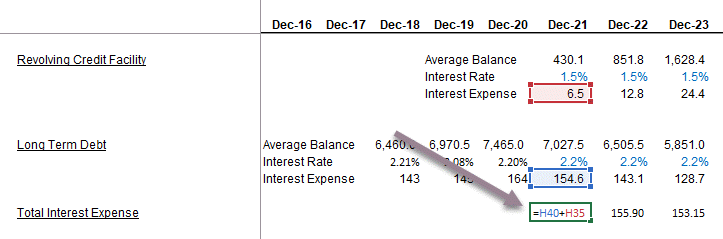
Calculate Interest Expense from Revolving Credit Facility
- Make a reasonable assumption for an interest rate based on the information provided in the 10K report.
- Find the average balance of the revolving credit facility and multiply it with the assumed interest rate.
Calculate the Interest Expense from the Long Term Debt
Link the historical average balances and interest expenses. Find the implied interest rate for historical years.
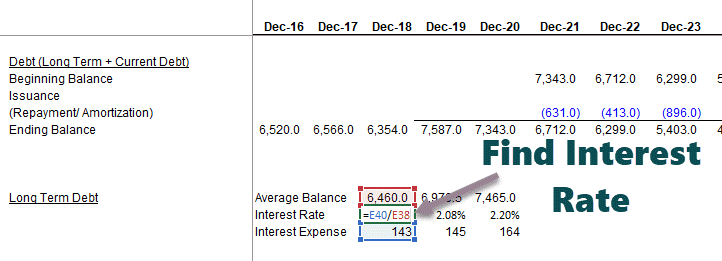
Assume the interest rate on Long term debt based on the implied interest rate. Then, multiply the average long-term debt by the assumed interest rate.
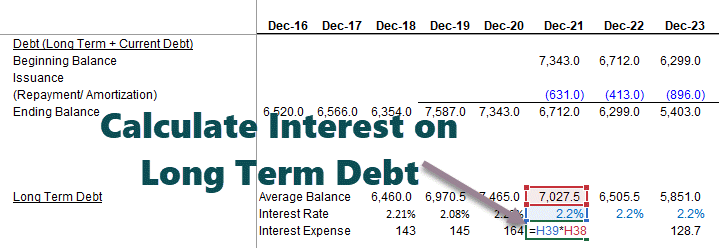
Calculate Total Interest Expense = average balance of debt x interest rate
Find the Total Interest Expense = Interest (Revolving Credit Facility) + Interest (Long Term Debt)
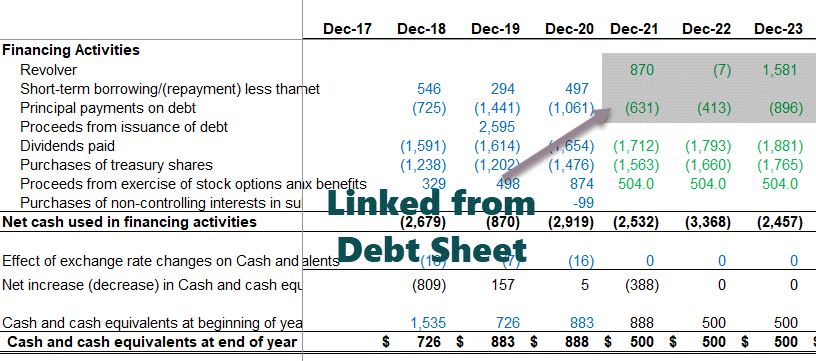
Link debt & Revolver drawdowns to Cash Flows

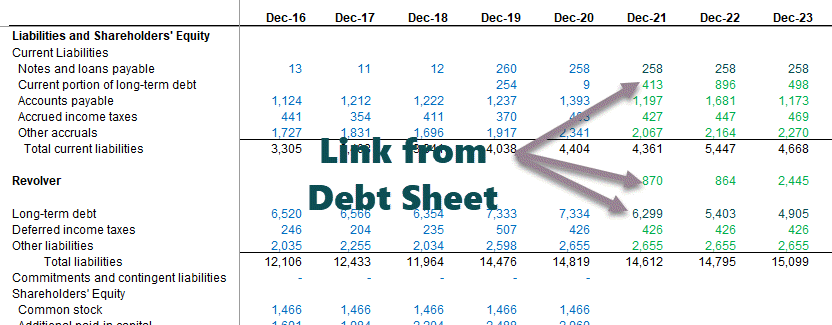
Reference Current and Long Term to Balance Sheet
- Demarcate the Current Portion of Long Term Debt and long-term debt as shown below.
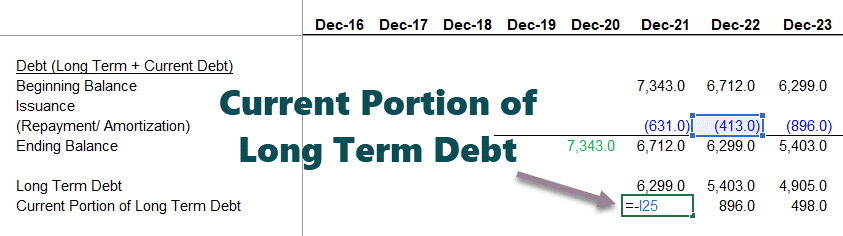
- Link the revolving credit facility, long-term debt, and current portion of long-term debt to the balance sheet.
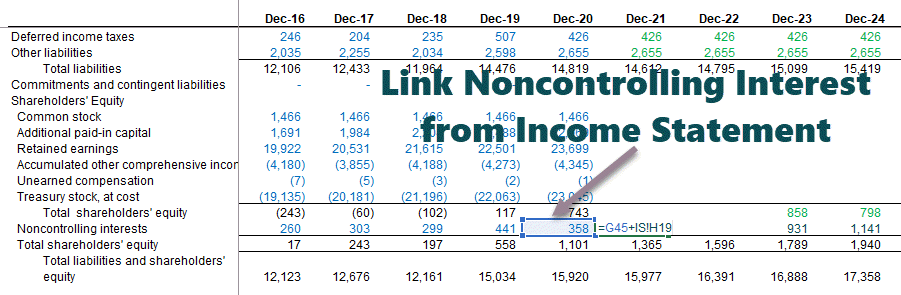
Link Noncontrolling Interest from Income Statement
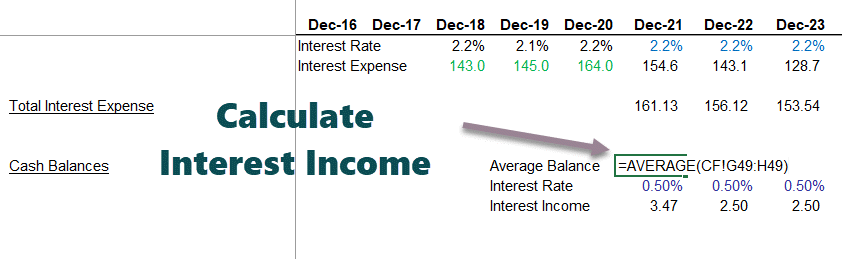
Calculate the Interest Income using the average cash balance
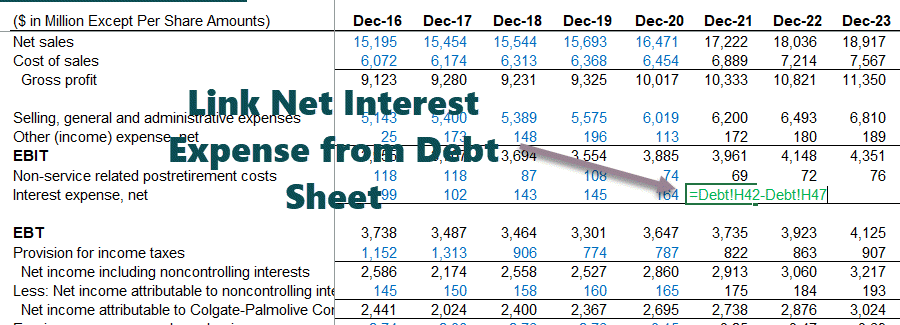
Link Interest Expense and Interest Income to Income Statement
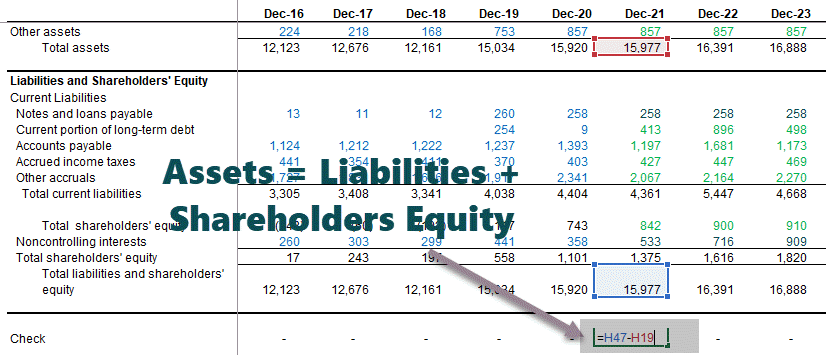
Perform the Balance Sheet check: Total Assets = Liabilities + Shareholder’s Equity
Audit the Balance Sheet
We need to audit the model and check for linkage errors if there is any discrepancy.
Understanding these principles can significantly impact this approach. This basic power pivot course is designed to deepen this knowledge and skill set for those eager to build on this foundation.
Best Practices
The technique follows some practices that make the models less complex, and gives proper projections for best use. Let us identify those practices.
- Goal – The first step of financial modeling using excel that should be kept in mind before making any financial model is to find out why it is required. The purpose of all financial models may not be the same. The management should identify whether it is for internal or for external usage. This decision will define the structure, layout, inputs and the output of the model. This will also ensure that the management does not get deviated from the actual objective.
- Timeline identification – It is equally important to understand how much time the model will take to be built, for what time-frame it can be used and the number of years of past data that may be entered in it for designing it correctly. Models used for many years are usually customized and contains a lot of details. The are typically quite flexible and sensitive to changes in inputs. For models meant for short duration, ideally readymade templates are often used which can be built easily but can also be modified easily by members within the business.
- Avoiding complicated formula – It is always better to avoid too many complications regarding formula in a financial modeling using excel, so that people who access those models find it easy to interpret them. If the formula are too complex, it is better to try and break them into steps for easy understanding. This may create many rows but it it makes the process easy to follow by any third party.
- Decide on the signs – The positive and negative signs used with the numbers should be consistent otherwise the final calculation will be incorrect and spotting mistakes will become highly complicated.
- Inputs should have simple location – It is better to have all inputs consolidated in a simple of fewer tab and use them as reference into various sheets so as to maintain transparency, simplicity and accuracy. In this way, the entire model will remain better organized.
- File linking ideas – It is always a better idea to not link files with models. Instead the data should be hard coded and entered in another sheet and imported from there to the model. Cross-linking often make models inconsistent and may lead to errors.
- No hiding sheets – Good models will have all sheets, lines, rows and columns visible for better analysis.
Thus, the above are some of the best practices that the makers of financial model should follow diligently so as to make it useful and interesting to understand and interpret.
Tips for Financial Modeling in Excel
Let us look at some useful tips one may consider to carry out the process in Excel.
- Focus On Accuracy: Any Excel function’s accuracy completely depends on the data one enters. Hence, individuals must thoroughly check the data when using formulas or functions to make sure that the information is accurate.
- Make The Most Of Different Functions: Excel has an extensive range of mathematical functions that one can apply to graphs, data sets, and charts. Some popular functions one may consider using are AVERAGE, MIN, SUM, and MAX.
- Utilize Online Templates: If individuals find it challenging to build a financial model in Excel from scratch, they can make use of financial modeling templates available online. These templates allow them to practice and become confident in building complex financial models in Excel.
- Check The Work Done: Once an individual finishes creating the model, they must check it thoroughly to identify errors. This is extremely vital if one prepares a model for a client. People must check all the columns and rows to ensure consistency and accuracy.
Frequently Asked Questions (FAQs)
What are the benefits of financial modeling in Excel?
Some of the benefits of carrying out this process in Excel are as follows:
- Excel lets analysts perform calculations, create visualizations, and filter data. With such capabilities, a company can find it easier to get valuable insights and make decisions backed by data.
- One can integrate Excel with different applications and databases. It enables data import and export and allows for converting the same into relevant formats.
- With Excel, one can customize layouts, formulas, and formulas according to their requirements. This makes financial modeling per the requirements of the industry or company convenient.
Other noteworthy benefits include the user-friendly interface and data visualization.
What are the different types of financial modeling in Excel?
Some popular types of financial modeling using Excel are as follows:
- Leveraged buyout modeling
- Discounted cash flow modeling
- Mergers and acquisitions modeling
What are some useful formulas for financial modeling in Excel?
Some popular formulas that one can use to carry out financial modeling in Excel include —
- SUMIF
- PMT
- VLOOKUP
- NPV
- IRR
Recommended Articles
Guide to what is Financial Modeling In Excel. We explain it with the best practices followed in the industry along with how to create it.