What Is Gamma Of An Option?
The term “gamma of an Option” refers to the range of the change in the delta of an option in response to the unit change in the price of the underlying asset of the option. Gamma can be expressed as the second derivative of the premium of the option with respect to the price of the underlying asset. It can also be expressed as the first derivative of the delta of the option with respect to the price of the underlying asset.
Gamma Function Formula Excel Template
Download Excel Template
The formula for gamma function can be derived by using a number of variables, which include asset dividend yield (applicable for dividend-paying stocks), spot price, strike price, standard deviation, option’s Time to expiration, and the risk-free rate of return.
Key Takeaways
- The gamma of an option is a measure of the rate of change of an option’s delta in relation to changes in the underlying asset’s price.
- It quantifies the sensitivity of an option’s delta to changes in the price of the underlying asset.
- Gamma is highest for at-the-money options and decreases as the option moves further in or out of the money.
- Option traders consider gamma as it affects the risk profile of the option and the potential for delta hedging.
Gamma Of An Option Explained
The gamma of an option, helps in measuring the change in option delta in relation to the change in price of the underlying asset. Therefore, it shows the sensitivity of the option to the asset’s price movement.
For proper understanding, the meaning of delta should be clarified in this context. It measures how much the price of the option has changed in relation to the price of the underlying asset of the option. The change may be a negative or a positive value and depends on whether the option is a put or a call.
In such a case, the gamma calculates the rate of change in the delta. It is always positive for both put and call and represents the second derivative in the option price. A high gamma can be linked to options that are at the money, in which the strike price is very near the underlying asset’s current price and is near the date of expiration. The reason is that a high gamma denotes volatility in the underlying asset’s price. As the option comes near the expiration date, the gamma increases, making it more sensitive to price change.
However, it is not a static value and keeps on changing with time. It is lower as the option moves out of the money or in the money.
How To Calculate?
Let us understand the formula of the concept and how to calculate it.
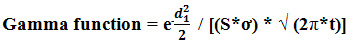
Mathematically, the gamma function formula of an underlying asset is represented as,


where,
- d1 = [ln (S / K) + (r + ơ2/2) * t] / [ơ * √t]
- d = Dividend yield of the asset
- t = Time to the expiration of the option
- S = Spot price of the underlying asset
- ơ = Standard deviation of the underlying asset
- K = Strike price of the underlying asset
- r = Risk-free rate of return
For non-dividend paying stocks, the gamma function formula can be expressed as,
The formula for gamma in finance can be derived by using the following steps:
- Firstly, thespot priceof the underlying asset from the active market, says the stock market for an actively traded stock. It is represented by S.
- Next, determine the strike price of the underlying asset from the details of the option. It is denoted by K.
- Next, check whether the stock is paying any dividend, and if it is paying, then note the same. It is denoted by d.
- Next, determine the maturity of the option or Time to expiration, and it is denoted by t. It will be available as details pertaining to options.
- Next, determine the standard deviation of theunderlying asset, and it is denoted by ơ.
- Next, determine the risk-free rate of return or asset return with zero risks for the investor. Usually, the return of government bonds is considered the risk-free rate. It is denoted by r.
- Finally, the formula for the gamma function of the underlying asset is derived by using the asset’sdividend yield, spot price, strike price, standard deviation, option’s Time to expiration, and a risk-free rate of return as shown below.


Example (with Excel Template)
Let us take the example of a call option with the following data.

Also, calculate the gamma at spot price
- $123.00 (out of money)
- $135.00 (at the money)
- $139.00 (in the money)
(i) At S = $123.00,
d1 = [ln (S / K) + (r + ơ2/2) * t] / [ơ * √t]
= [ln ($123.00 / $135.00) + (1.00% + (30.00%)2/2) * (3 / 12)] / [30.00% * √(3 / 12)]
= -0.3784
Therefore, the gamma of a call option can be calculated as,
Option’s gamma S=$123.00
= e-[d12/2 + d*t] / [(S*ơ) * √(2ℼ*t)]
= e-[0.22352 /2+ (3.77% * 3/12)] / [($123.00 * 30.00%) * √(2π * 3/12)]
= 0.0193
(ii) At S = $135.00,
d1 = ln (S / K) + (r + ơ2/2) * t] / [ơ * √t]
= [ln ($135.00 / $135.00) + (1.00% + (30.00%)2/2) * (3 / 12)] / [30.00% * √(3 / 12)]
= 0.2288
Therefore, the gamma function calculation of the option can be calculated as,
Option’s gamma S=$135.00
= e-[d12/2 + d*t] / [(S*ơ) * √(2ℼ*t)]
= e-[ 0.22352 /2+ (3.77% * 3/12)] / [($135.00 * 30.00%) * √(2π * 3/12)]
= 0.0195
(iii) At S = $139.00,
d1 = [ln (S / K) + (r + ơ2/2) * t] / [ơ * √t]
= [ln ($139.00 / $135.00) + (1.00% + (30.00%)2/2) * (3 / 12)] / [30.00% * √(3 / 12)]

= 0.2235
Therefore, the gamma of a call option function shows the calculation of the option as given below:

Option’s gamma S=$139.00
= e-[d12/2 + d*t] / [(S*ơ) * √(2ℼ*t)]
= e-[ 0.22352 /2+ (3.77% * 3/12)] / [($139.00 * 30.00%) * √(2π* 3/12)]
= 0.0185
For a detailed calculation of gamma, function refer the given excel sheet above.
Relevance And Uses
Given below are some instances where the traders and investors of the derivative market can use this concept.
It is important to understand the concept of gamma function because it helps in the correction of convexity problems seen in the case of hedging strategies. One of its applications is the delta hedge strategy, which seeks a reduction of gamma in order to hedge over a wider price range. However, the reduction of gamma results in a reduction of alpha too.
Further, the delta of an option is helpful for a shorter period, while the gamma helps a trader over a longer horizon as the underlying price changes. It is to be noted that the value of gamma approaches zero as the option goes either deeper into the money or deeper out of the money. The gamma of an option is the highest when the price is at the money. All long positions have a positive gamma. In contrast, all the short options have negative gamma.
You can download this Gamma Function Formula Excel Template from here – Gamma Function Formula Excel Template
Frequently Asked Questions (FAQs)
1. Does gamma remain constant throughout the life of an option?
No, gamma does not remain constant throughout the life of an option. It is highly dynamic and changes as the underlying asset price, time to expiration, and implied volatility change. Gamma tends to be higher for at-the-money options and decreases as the option moves further in- or out-of-the-money.
2. What is a good gamma for options?
There is no specific value for a “good” gamma for options, as it depends on an individual’s trading strategy and risk tolerance. Generally, higher gamma values indicate greater sensitivity to changes in the underlying asset’s price, which can benefit traders seeking higher potential profits and entail increased risk.
3. How can I calculate gamma for an option using different pricing models?
Gamma can be calculated for an option using various pricing models, such as the Black-Scholes model, the binomial model, or numerical methods like finite difference approximations. These models consider inputs like the underlying asset price, strike price, time to expiration, risk-free interest rate, and implied volatility to determine the option’s gamma value.
Recommended Articles
This has been a guide to what is Gamma Of An Option. We explain how to calculate it along with example using excel template and its relevance and uses. You can earn more about investments from the following articles –