Table of Contents
What Is Kinked Demand Curve?
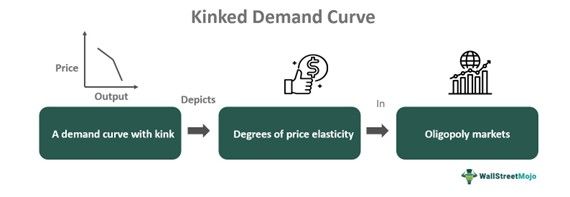
A kinked demand curve depicts a demand curve that deviates from linearity, exhibiting varying degrees of elasticity across different price ranges. This phenomenon illustrates how firms in oligopolies engage in interdependent behavior. It shows greater elasticity for prices surpassing the market price and reduced elasticity for prices falling below it.

The theory offers insights into how companies make strategic pricing choices in fiercely competitive markets. It explains why prices remain stable and inflexible in such environments, as companies often steer clear of altering prices to evade fierce competition. Utilizing the demand curve model enables the analysis of strategic interactions among firms, comprehension of pricing patterns, and anticipation of market results.
Key Takeaways
- The kinked demand curve in oligopoly illustrates non-linear elasticity across price ranges, explaining oligopolistic market behavior.
- Firms face highly elastic demand above the price, reducing revenue with price increases.
- Below the price, demand is inelastic, limiting revenue growth with price reductions.
- Developed by Sweezy and others, it revolutionized the understanding of oligopolistic markets in 1939, despite later criticisms and the emergence of the cartel theory addressing its limitations
- Despite limitations in explaining market dynamics and adjustments, the theory sheds light on oligopolistic pricing strategies.
- However, it overlooks brand differentiation, market dominance, and non-price competition.
Kinked Demand Curve Explained
The kinked demand curve in oligopoly proposes a non-linear correlation between a firm's and competitors' prices. According to the kinked demand curve theory, if a firm raises its price beyond a specific threshold, its competitors are unlikely to do the same, leading to a highly elastic demand curve. Conversely, lowering the price below this threshold often prompts competitors to follow suit, resulting in a more inelastic demand curve.
Similar to conventional demand curves, the kinked demand curve model exhibit a downward slope. However, unlike traditional demand curves, they feature a distinctive 'kink,'' representing a sudden discontinuity at a concave bend. This unique characteristic distinguishes them from standard demand curves.
In oligopolistic markets, firms must change demand curves as competitors adjust prices and output quantities. Despite potential cost variations, prices often exhibit long-term rigidity or inflexibility for long periods. This hypothesis suggests that an oligopoly demand curve features a distinct kink at the prevailing price level.
This kink is attributed to two key factors: the first is that the segment in the curve that is above the prevailing price is highly elastic. The second one is that the segment below prevailing price levels is inelastic. It means that demand becomes less elastic below the kink and more elastic above it. This implies that there is more response to price decreases than increases. The theory revolves around the strategic behavior of firms aiming to maximize profits, particularly in industries dominated by a few key players.
Given below is a kinked demand curve diagram:
Drawing a kinked demand curve diagram requires plotting a demand curve with a kink. The bend should be at the current market price, illustrating the difference in demand elasticity above and below the kink.

Assumptions
The kinked demand curve model on the following assumptions:
- The market comprises a small number of firms.
- Advertising expenditure by these firms is minimal.
- Firms possess comprehensive or perfect knowledge or information about the demand curve.
- They produce products that are close substitutes.
- Firms recognize their mutual dependence.
Examples
Let us look at some examples to understand the concept
Example #1 - A Hypothetical Example
Let's consider two petrol stations located in the XYZ area. The petrol market in this area is an oligopoly, with two dominant stations. The petrol sold by both stations is identical (homogeneous), and consumers in this market are highly price-sensitive.
Initially, both petrol stations have set their prices at a similar level, resulting in a stable market condition. However, Station A, seeking to increase its profits, decides to raise its petrol price. Due to the price increase, consumers become more price-sensitive and start shifting their demand to Station B, which maintains its original lower price.
Above the kinked point, Station A faces a highly elastic demand curve, meaning that consumers are very responsive to price changes. As a result, Station A experiences a significant decrease in the quantity of petrol demanded, resulting in a decline in its revenue.
Recognizing the impact of Station A's price increase, Station B strategically decides to match the lower price to retain its customers and gain a competitive advantage. This action reinforces the kinked demand curve. Below the kinked point, Station B faces a relatively inelastic demand curve, indicating that consumers are less responsive to price changes.
Example #2 - A Real-Life Example
Dr. P. Sekar analyzed the kinked demand curve's validity in Chennai's granite industries (India). The study statistically confirmed the presence of price rigidity and price leadership in these industries. It revealed intense competition leading to price wars among the granite firms, indicating a struggle for survival. The findings suggest that the kink theory applies primarily in depressed markets. Moreover, the study observed that followers in the market match price increases set by the leader, indicating a healthy and competitive market condition in the granite industry.
Limitations
The demand curve theory only partially explains oligopolistic market behavior, leading to criticism from many economists. Numerous shortcomings of this demand curve theory were addressed with the emergence of the cartel theory. Despite its limitations, the kinked demand curve theory was the most comprehensive explanation for oligopolistic market behavior in 1939. Given below are its limitations:
- The theory lacks clarity on establishing the kink in the demand curve.
- It doesn't explain or address the adjustments of the demand curve in response to variations or changes in prices or quantities.
- The kinked demand curve theory largely disregards the tendency of other oligopolists to follow pricing decisions made by one firm.
- It neglects the possibility of collusion among oligopolists when determining prices and quantities.
