


What Is Off-The-Run Treasury Yield Curve?
The off-the-run treasury yield curve is the graphical representation of the interest rates and maturity of the old U.S. Treasury securities released before the current U.S. Treasury debt instruments’ issuance. Thus, such a yield curve shows the performance of the older issues that have been previously auctioned and are still outstanding.
The curve summarizes the yields of off-the-run treasury securities with various maturities by projecting these yields against their respective maturities. It thereby depicts the relationship between the treasury’s interest rates and the time to maturity. Hence, it is a crucial tool to gauge a broader economic outlook and analyze the market expectation for treasury securities’ interest rates over the period.
Key Takeaways
- An off-the-run treasury yield curve charts an old U.S. Treasury security’s prices and interest rate changes over its time to maturity on a graph.
- An off-the-run Treasury is a U.S. government security such as a T-Bond, TIPS, or savings bond issued earlier than the latest U.S. Treasury issuance. It is low-priced and high-yielding security when compared to the new issues.
- While this parameter helps determine the market expectations for treasury returns over the period, an on-the-run treasury yield curve is used as a pricing benchmark for treasury securities.
Off-The-Run Treasury Yield Curve Explained
An off-the-run treasury yield curve charts the yield or interest rates of a previously issued treasury debt instrument against its time to maturity on a graph. The U.S. Treasury Department frequently conducts auctions to issue new Treasury securities such as Treasury bonds, savings bonds, and Treasury Inflation-Protected Securities (TIPS) to meet the government’s financial requirements through public borrowings. At the time of issuance, these debt instruments are considered “on-the-run” Treasury securities. However, when another set of securities is issued, the previously released debt instruments become “off-the-run” Treasury securities and are available for trading in the secondary market.
The graph of a treasury yield curve is upward-sloping in normal economic conditions. However, market analysts consider the on-the-run treasury yield curve as a critical reference point for determining the prices of the new fixed-income securities. However, the off-the-run yield curve is used by traders and investors to anticipate the interest rate fluctuations of these fixed-income securities over the period.
Moreover, such a curve is more stable and smooth than the on-the-run treasury yield curve. Also, off-the-run securities tend to have lower trading volumes in the secondary market. Moreover, it is often compared to the on-the-run treasury yield curve to identify any disparities or variances in yields between the two sets of securities. These disparities can arise due to variations in liquidity, investor preferences, or changes in market conditions.
Examples
Let us look at some examples to understand the concept better:
Example #1
Suppose the U.S. Treasury auctions a batch of 20 years T-Bond on April 10, 2023; it is an on-the-run Treasury bond, and its yield curve will be the on-the-run treasury yield curve. However, on May 15, 2023, it again issued 20 years of Zero Coupon T-Bonds to borrow more funds. Then, the previous batch will become the off-the-run Treasury bonds, and the new batch will be known as the on-the-run Treasury bonds. Also, the yield curve of the April batch will be known as the off-the-run Treasury yield curve.
Example #2
Below is a graph showing the historical yield of a treasury bond from 1962 to present:
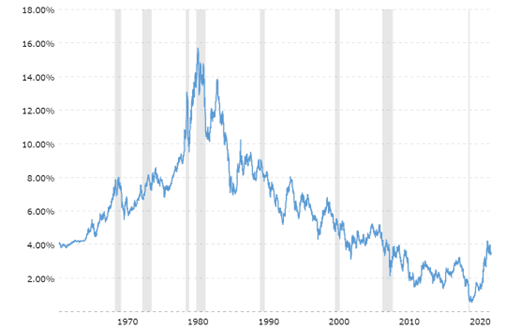
In the past decades, the 10-year treasury yield peaked at 15.25% on August 24, 1981. However, after that, the curve showed a downside trend, dropping to 0.59% on July 20, 2020. Beyond this point, the yield curve moved upward, securing the confidence of the investors. Indeed, the recent 10-year treasury yield is 4.62% as of April 19, 2024.
Off-The-Run Treasury Yield Curve Vs. On-The-Run Treasury Yield Curve
The terms “off-the-run” and “on-the-run” describe different points along the yield curve for U.S. Treasury securities in the financial industry. Thus, they differentiate between recently issued and previously issued Treasury securities regarding interest rates and maturity. Following are the various distinctions between off-the-run and on-the-run Treasury yield curves:
| Basis | Off-The-Run Treasury Yield Curve | On-The-Run Treasury Yield Curve |
|---|---|---|
| Meaning | It depicts the yields along the time to maturity of previously issued U.S. Treasury securities that are no longer the most recently issued ones on a graph. | It represents the current yields and time to maturity of recently issued U.S. Treasury debt instruments on a graph. |
| Issuance | Old or previously issued Treasury debt instruments. | New or recently issued Treasury securities. |
| Shape | A smooth curve usually slopes upwards. | Distorted curve with more price fluctuations. |
| Liquidity | Low when compared to on-the-run treasuries. | Most actively traded treasuries. |
| Trading Volume | Low | High |
| Outstanding Treasuries | A majority of outstanding US treasuries are off-the-run. | It is only a tiny portion of the overall US Treasuries. |
| Treasury Price | Comparatively Low | Higher |
| Yield | High | Low |
| Time To Maturity | Less time to maturity compared to the corresponding on-the-run treasuries. | Long time to maturity. |
| Variation or Volatility | It is quite stable | It is comparatively more volatile as price distortions are observed due to changes in ongoing demand. |
| Co-relation | Smoothens the deformities of an on-the-run treasury yield curve. | Every on-the-run treasury yield curve extends to become an off-the-run yield curve. |
| Use | Gauging the yield trend of the fixed-income securities over the period. | It serves as a significant benchmark for ascertaining the price of other fixed-income assets like T-bonds. |
It is important to note that while the on-the-run and off-the-run yield curves may differ slightly, they generally move in tandem and reflect overall market conditions and interest rate expectations. Both yield curves are valuable indicators for investors, traders, and analysts when assessing the fixed-income market and making investment decisions.
Frequently Asked Questions (FAQs)
Frequently Asked Questions
How does an off-the-run treasury yield curve look?
The graph of an off-the-run yield curve is upward-sloping and looks more stable than the on-the-run treasury yield curve. It depicts the movement of prices and interest rates of a Treasury bond, TIPS, or savings bond over its maturity.
Why do off-the-run treasury yield curve bonds have higher yields?
The investors pay a premium on on-the-run treasury securities due to their better liquidity. Hence, off-the-run bonds cost comparatively less than the former, which is why they offer higher yields.
Does the off-the-run treasury yield curve predict a recession?
When such a Treasury yield curve inverts, it may pose signs of economic recession. However, it cannot be considered the only indicator, and market analysts should look out for other key parameters like the jobs market, wage growth, economic cycle, market fluctuations, etc.
What are some factors that drive off-the-run treasury yield curve?
The prominent factors that result in the fluctuation of an off-the-run treasury yield are the changes in the prices and interest rates of the Treasury securities over the period. The demand and supply of particular security, economic growth, inflation, recession, etc., influence these factors.