Table Of Contents
What Is Production Volume Variance?
Production volume variance is defined as the variance in production cost observed by the business concerning the budgeted or anticipated value and its actual value. It is a statistical metric employed by the business to compare actual and anticipated or expected overheads related to the production process.
Explanation
Production volume variance is a variance between actual cost and budgeted cost of the production process and is also referred to as the variance in volume. One of the critical aspects of any business is determining the overall costs of overheads. The determination of overhead expenses is necessary as such costs are of a fixed nature.
Irrespective of the volumes received by the business or the number of units manufactured by the business, the metric on overhead costs remains to be fixed. The overhead costs generally comprise purchases of equipment, rent on factories and warehouses, and the cost of insurance. Additionally, there is the presence of other costs that generally change as per the volume managed or handled by the business.
Such costs comprise expenditures on raw materials, goods and services transportation, and storage costs of finished goods. Such costs may vary concerning the higher levels of volume. The variance in the production volume is generally static and stale.
The production variance tends to happen because the business may have determined an expected value that could be older in value and even before the beginning of the production process. Hence it is regarded as a stale metric, and the business may choose other available statistics. The other metrics could be the production of the number of units per day at the predefined cost.
Formula
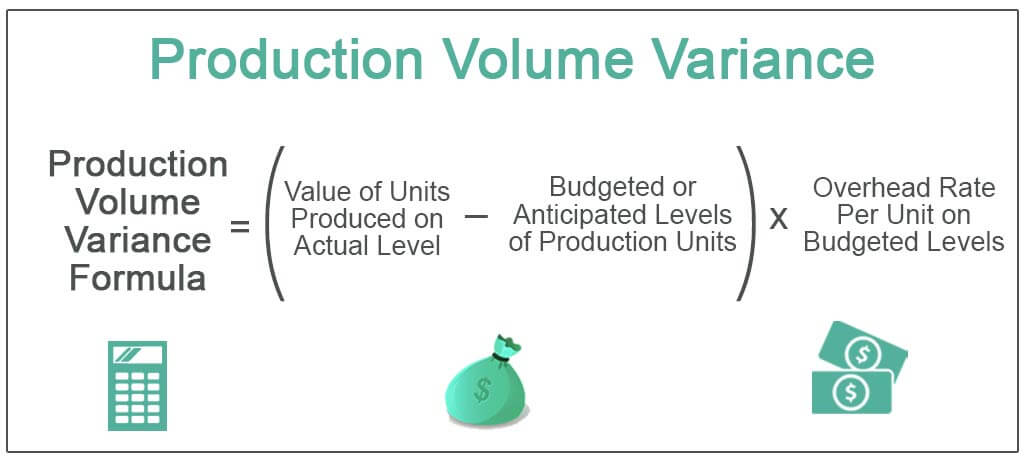
Production Volume Variance = (Value of Units Produced on Actual Level – Budgeted or Anticipated Levels of Production Units) x Overhead Rate Per Unit on Budgeted Levels

Examples
Below are some examples to understand the concept in a better way –
Example #1
Help the management determine production volume variance. Let us take the example of ABC company. The ABC company anticipated it could produce 8,000 units for the coming year at the overhead rate per unit of $20. However, later that year, the business produced 9,400 units.
Solution

- = (9,400 – 8,000) x $20
- = $28,000
Therefore, the business observed a production variance of $28,000. It is regarded as favorable as the business utilizes more units corresponding to the fixed costs the business has to bear, thereby driving operational efficiency.
Example #2
Help the management determine production volume variance. Let us take the example of the PQR company. The PQR company anticipated it could produce 10,000 units for the coming year at the overhead rate per unit of $20. However, later that year, the business produced 7,400 units.
Solution

- = (7400 – 10000) x $20
- = -$52,000
Therefore, the business observed a production variance of -$52,000. It is regarded as unfavorable as the business utilizes fewer units corresponding to the fixed costs it has to bear, thereby driving operational efficiency.
Importance
The production volume variance is an important statistical metric that helps the business compare actual overhead costs incurred by the business with the anticipated value of the overhead costs. The production variance analysis, therefore, forms a part of the standard costing process of the business. Whenever a business generates unfavorable levels of production variance analysis, it means that the overall fixed costs that the business utilized for generating the output were less than what was anticipated or expected values of the budgeted values. It further indicates that the total number of units results in higher production costs per unit.
The production volume variance is regarded as favorable whenever the actual fixed costs exceed the budgeted value. It signifies that the overall cost of production covered a greater number of finished goods or outputs. Therefore, it indicates how well the business is performing on operational levels.
Advantages
The production volume variance is a useful metric as it helps the business determine the volume of the production process that it could focus on to drive business operations at low costs, with maximum volume, and at higher profits. It as a metric helps businesses understand whether or not they could produce or manufacture enough finished goods to drive profitability and sustain business operations. The metric helps the business achieve operational excellence as it helps businesses focus more on the achievement of more than the budgeted values.
The main focus remains on the overhead costs per unit basis and not on the total cost of production. Since many production costs tend to be fixed, such higher values drive the higher value of profits.
Conclusion
The production volume variance is the variance between actual overhead costs and budgeted overhead values. It is a statistical measure that helps the business plan its operational capacity, which then helps the business to drive efficient business operations and, in turn, reap maximum profitability.
Recommended Articles
This has been a guide to what is Production Volume Variance. Here we discuss how to calculate production volume variance and its advantages and importance. You may learn more about financing from the following articles –

